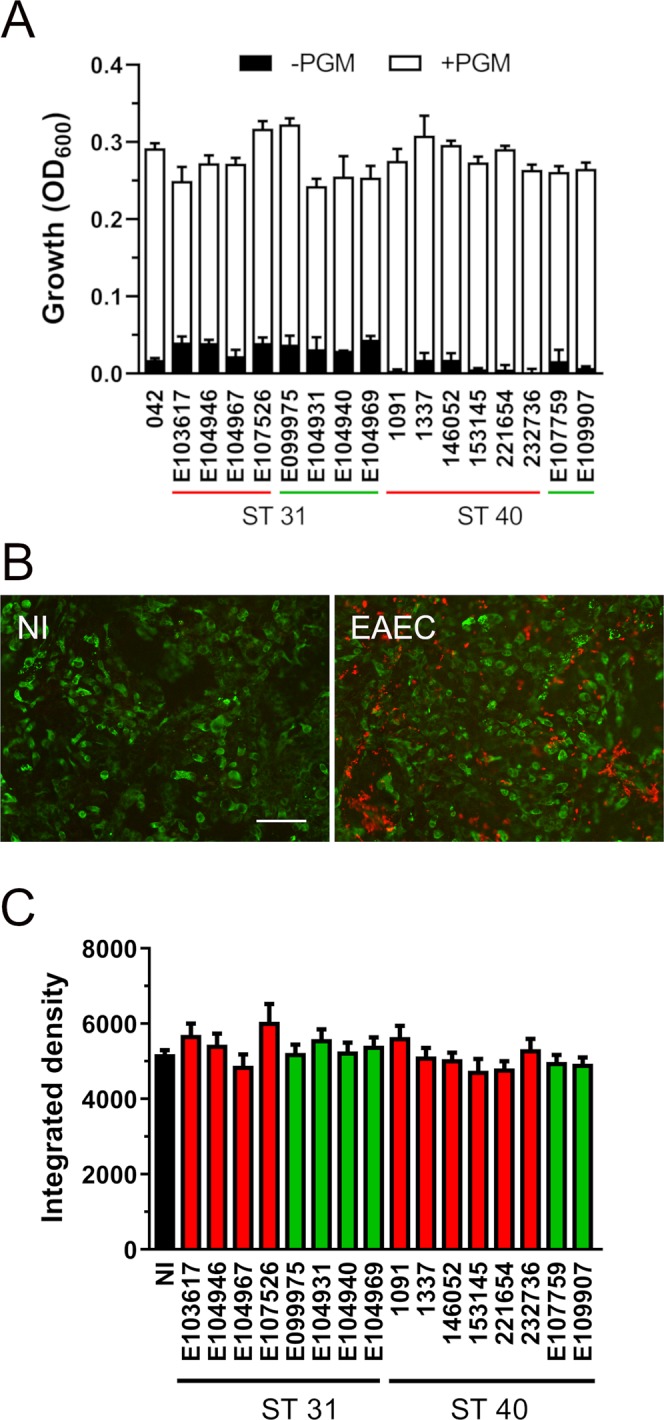
Figure 3.

(A) Growth of EAEC ST strains in M9 medium with (+PGM) or without 0.5% porcine gastric mucin (-PGM) for 8 h was determined by optical density (OD600). Strains from cases or controls are underlined in red and green, respectively. Results represent the mean ± SE from three independent experiments. Data from groups of ST31 and ST40 isolates were analysed using Student’s unpaired t-test. (B) Influence of EAEC infection on mucin production by LS174T cells. Cells were infected with EAEC strains for 4 h or left non-infected (NI). Mucus production was visualised by immunofluorescence staining for MUC2 (green), and EAEC were stained in red. Shown are representative images of NI samples and cells infected with E104931 (EAEC). Bar = 50 μm. (C) MUC2 staining was quantified by integrated density. Results represent the mean ± SE from at least four independent experiments in duplicate. Data from groups of ST31 and ST40 isolates were analysed using Student’s unpaired t-test.
