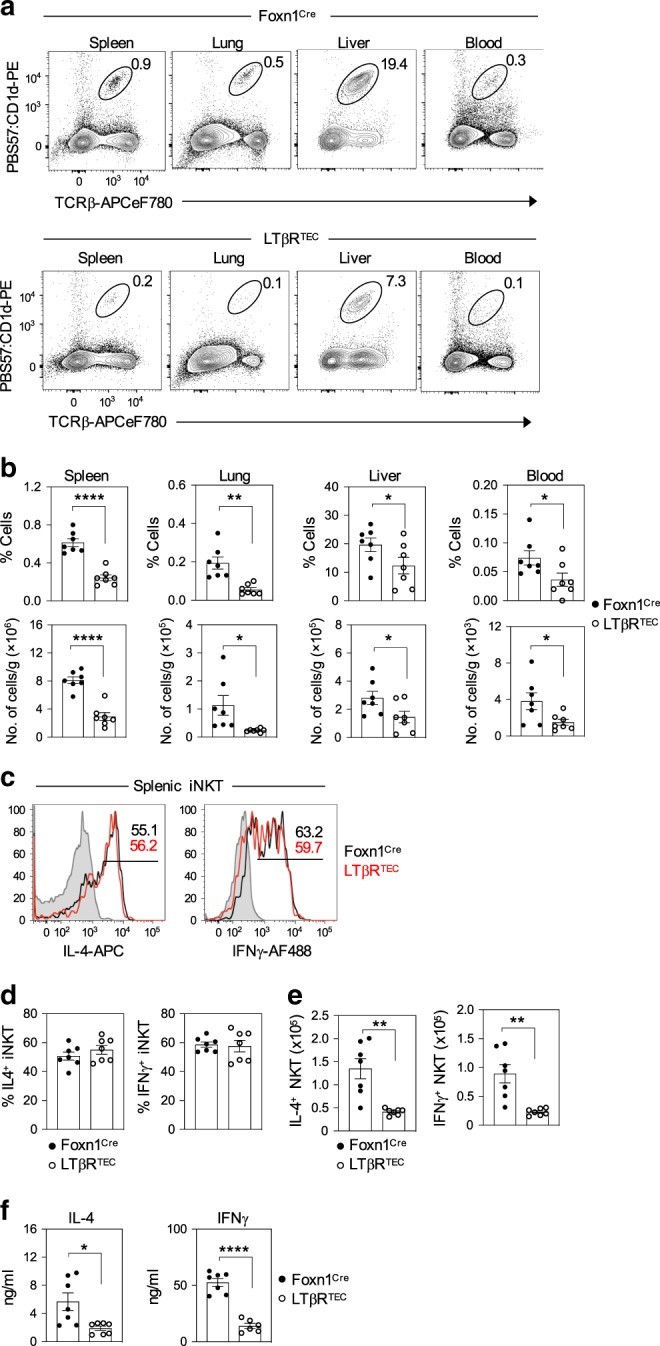
Fig. 8. LTβR expression by thymic epithelium determines peripheral iNKT-pool size.

a indicated that tissues from control Foxn1Cre and LTβRTEC mice were analysed for iNKT cell frequencies by flow cytometry. Graphs in b show cell percentages and number of iNKT cells per gram or ml of tissue, as indicated, in Foxn1Cre (n = 7 biologically independent samples, closed symbols) and LTβRTEC (n = 7 biologically independent samples, open symbols), over three independent experiments. Significant P values using two-tailed unpaired t test are as follows: % spleen P ≤ 0.0001, % lung P = 0.0012, % liver P = 0.0494, % blood P = 0.0383, no. of cells in the spleen P ≤ 0.0001, no. of cells in the lung P = 0.0255, no. cells in the liver P = 0.0459, no. of cells in blood P = 0.0371. c Flow cytometric analysis of intracellular IL-4 or IFNγ expression in splenic iNKT cells in Foxn1Cre (black lines) and LTβRTEC (red lines) mice, 2 h after i.v. administration of αGal-Cer. Grey histograms show levels of staining in non-injected mice. Percentages (d) and numbers (e) of IL-4+ and IFNγ+ splenic iNKT after αGal-Cer stimulation of Foxn1Cre (n = 7 biologically independent samples, closed symbols) and LTβRTEC mice (n = 8 biologically independent samples, open symbols), over three independent experiments. Significant P values using two-tailed unpaired t test as follows: no. of IL-4+ cells P = 0.0011, no. of IFNγ+ cells P = 0.0014. f shows ELISA quantitation of IL-4 (2 h post Gal-Cer injection) Foxn1Cre (n = 7 biologically independent samples, closed symbols) and LTβRTEC mice (n = 7 biologically independent samples, open symbols), and IFNγ (16 h post Gal-Cer injection) in serum samples of Foxn1Cre (n = 7 biologically independent samples, closed symbols) and LTβRTEC mice (n = 6 biologically independent samples, open symbols), over three independent experiments. Significant P values using two-tailed unpaired t test are as follows: IL-4 P = 0.0117, IFNγ P ≤ 0.0001. All data are represented as mean ± SEM. *P < 0.05, **P < 0.01, and ****P < 0.0001. Source data are provided as a Source Data file.
