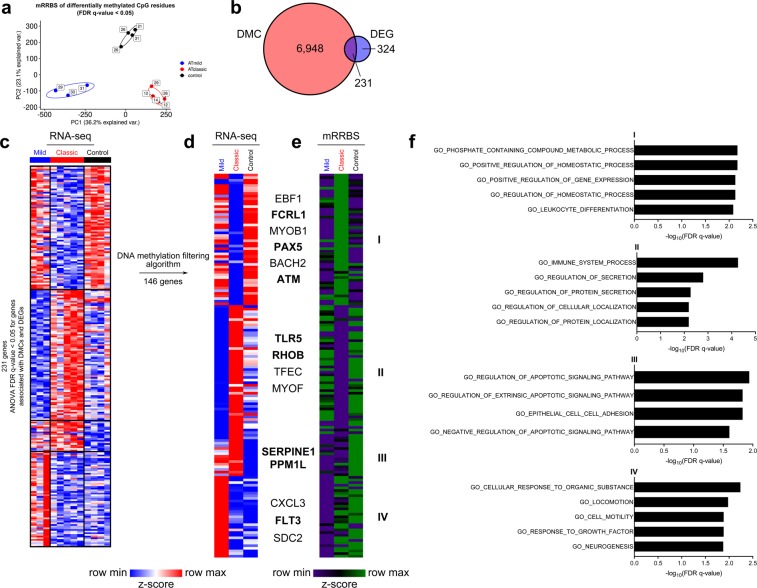
Figure 3.
Distinct DNA methylation profiles identify A-T phenotypes. (a) Principal component analysis of 66,410 differentially methylated CpGs (DMCs) identified from a beta-binomial regression model with an arcsine link function fitted using the generalized least square method and Wald-test FDR q-value <0.05. Ellipses represent normal contour lines with one standard deviation probability. Points are annotated with participant age in years. (b) Venn diagram partitioning genes associated with differentially methylated cytosines (DMCs) within 2 kb of their gene bodies (inclusive) and differentially expressed genes (DEGs), all with FDR q-value <0.05. (c) K-means clustering of 231 DEGs associated with differentially methylated CpGs (DMCs); k = 4 and scaled as z-score across rows. (d) Results of filtering promoter (transcriptional start site ± 1 kb) CpGs by 25% difference in CpG methylation between groups. For each k-means cluster, CpGs with 25% higher methylation in lower expression groups compared with higher expression groups passed the filter. The heat map shows average gene expression (log2-transformed read counts per million) for 146 genes passing the methylation difference filter scaled as z-score across rows. (e) Merged-replicate average CpG methylation in gene promoters scaled as z-score across rows for the 146 loci passing the methylation difference filter. For (d) and (e), genes are ordered as in (c). (f) Top five gene ontology (GO) processes derived from each k-means cluster ranked by -log10-transformed FDR q-value for the genes in (e and f).

