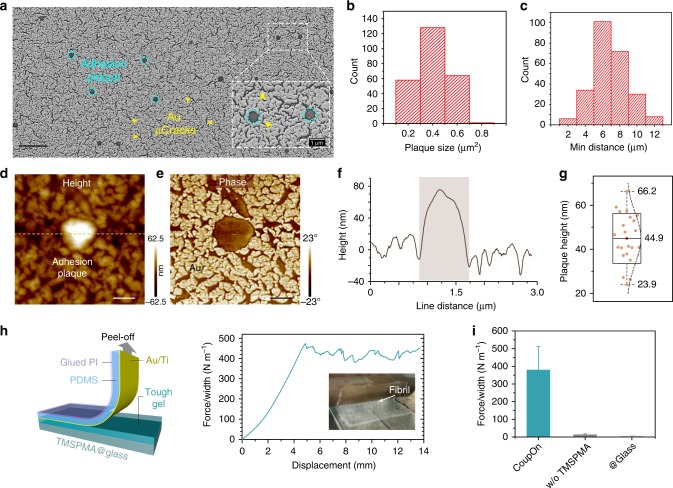
Fig. 2. Formation of cytoadhesion-like plaques endowed the strong interlayer bonding.
a SEM image shows the formation of discrete hydrogel-elastomer adhesion plaques (cyan circles), which are out of the metallic nanofilm through the microcracks (yellow arrowheads) as shown in the inset (dash white rectangle). Representative of three samples after elastomer removal. Scale bar, 5 µm. b Histogram plot shows the size distribution of adhesion plaques. c Histogram plot shows the distribution of minimum distances between adhesion plaques in proximity. Two hundred and forty-six adhesion plaques are analyzed. d AFM height profile shows the out-of-plane adhesion plaques (white zone). e AFM phase image showed a clear distribution of metallic nanofilm and microcracks filled by the tough gel. Representative image of three samples. Scale bar, 0.5 µm. f Line plot shows the height profile along the dash line in d. g Box chart shows the height of adhesion plaques compared to the peripheral metallic nanofilm. Twenty-two adhesion plaques are analyzed. Upper and lower whisker denote the max and min data value, upper and lower quartile denote ± SD, middle quartile denotes the mean. h Schematic illustrates the 90° peel-off test setup and line plot shows the interlayer adhesion between the metallic nanofilm/elastomer and tough gel. Inset: Photograph shows the formation of fibrils during the peel-off test. i Bar chart shows the adhesion strength of different interfaces. “w/o TMPSPMA” group refers to non-silanized metallic nanofilms on PDMS, “@Glass” group refers to Au/Ti nanofilms on the glass that forms non-microcracked Au/Ti nanofilms. Representative of three to five samples with a dimension of 1.5 cm by 4.0 cm. Data are presented as mean ± SD.

