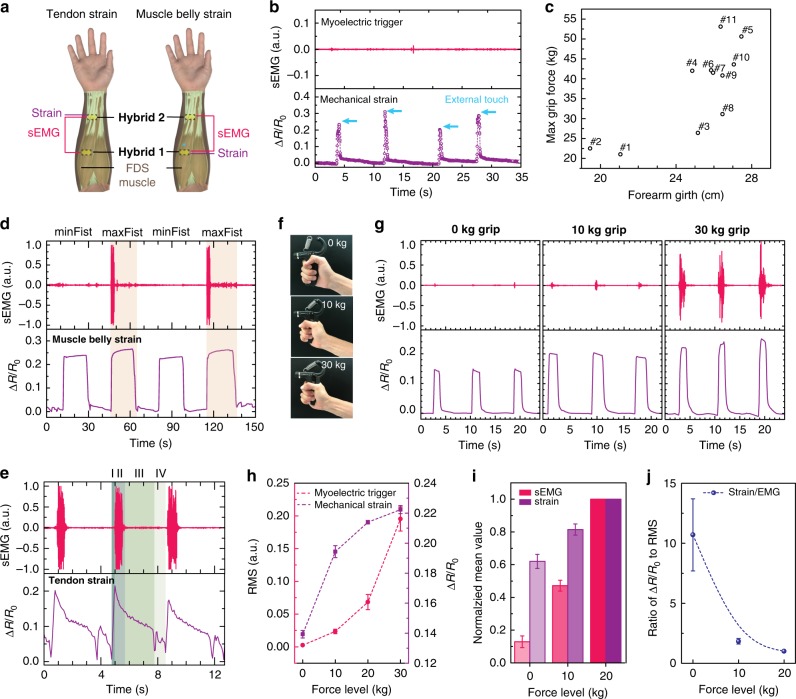
Fig. 4. Identification of muscular excitation–contraction signatures.
a Schematic of a pair of CoupOn (hybrid 1 and 2) along flexor digitorum superficialis (FDS) muscle, with hybrid 1 at the FDS belly as the muscle belly strain sensor or hybrid 2 at the FDS origin as the tendon strain sensor. b Graph shows that resistive strain sensing of CoupOn incurred little influence on sEMG recording. In the case of passive external touch, the strain was detected without sEMG artifacts. c Circle plot shows biometrics of 11 subjects. d Plots show the local coupling of sEMG recording with resistive strain sensing that distinguished a minFist (minimal voluntary contraction) from a maxFist (maximal voluntary contraction). Representative of five tests. e Plots show the electromechanical coupling during the maxFist using the tendon strain sensor. In contrast to d, the excitation–contraction signatures comprised four distinct phases as follows: (I) Fist closing, (II) Fist tightening, (III) Fist relaxing, (IV) Fist opening. Data obtained on subject 9. f, g Photographs and plots showing the excitation–contraction signatures of hand grips at force levels of 0 kg, 10 kg, and 30 kg, respectively. h Plots show that both root mean square (RMS) of sEMG signals and resistive strain sensing increased with force levels. Strain sensing appeared more sensitive to the force increase in the lower end, while sEMG seemed more responsive to the force increase in the higher end. Data obtained on subject 5. i Bar chart shows the normalized mean RMS of sEMG and resistive strain signals. j Plot shows the ratio of normalized resistive strain signals to sEMG RMS. It suggests the local coupling efficiency of myoelectric trigger and mechanical strain decreases with the force level. Data obtained from the 11 subjects and normalized using respective signal amplitudes at 20 kg grips. Data are presented as mean ± SEM.

