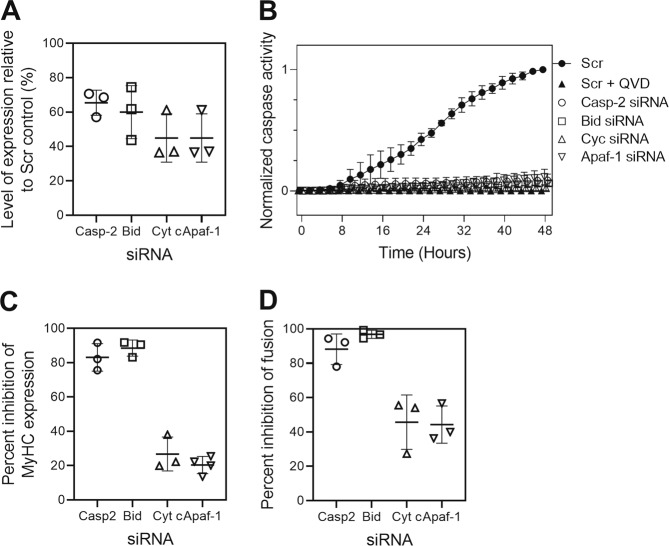
Fig. 8. The effects of Casp2 and Bid siRNA compared with Cyt c and Apaf-1 siRNA.
a The protein levels after siRNA treatment relative to the effect of a scrambled siRNA. Quantitation performed using fluorescent secondary antibodies and Licor™ scanner. b Live-cell imaging of caspase-3 activity using the Incucyte. C2C12 cells transfected with different siRNAs (100 nM) were incubated with a cell permeable substrate (5 µM) and images were captured every 2 h for 48 h. The data were normalized to the maximum fluorescence intensity of the control siRNA at 48 h and expressed as the mean ± SD of three independent experiments (*P < 0.05). Percent inhibition of myosin heavy chain expression (c) and cell fusion (d) by the different siRNAs. The data are the mean ± SD of three independent experiments.

