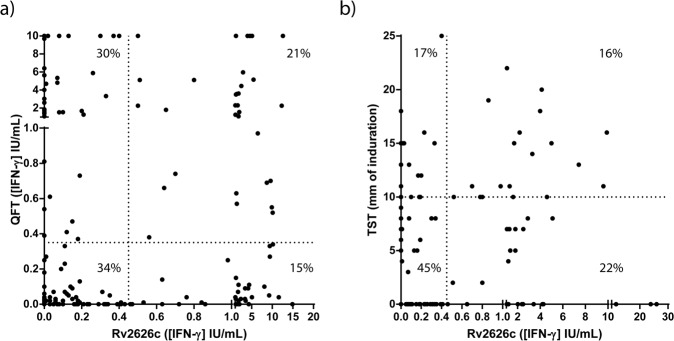
Figure 2.
(a) Scatter plot of IFN-γ levels as measured by QFT and by Rv2626c IGRA. IFN-γ levels in whole blood of participants were measured by using the QFT kit and the Rv2626c IGRA assay. The vertical dotted line represents the Rv2626c IGRA cut-off (0.45 IUIFN-γ/mL); the horizontal dotted line indicates the QFT cut-off (0.35 IUIFN-γ/mL). Percent Concordant = 55%; Percent Discordant = 45%. Kappa = 0.106. SE of kappa = 0.066. Slight agreement. (b) Scatter plot of mm of induration measured by TST and IFN-γ levels measured by the Rv2626c IGRA. IFN-γ levels in whole blood of participants were measured by using the Rv2626c IGRA assay. The vertical dotted line represents the Rv2626c IGRA cut-off (0.45 IUIFN-γ/mL). The skin test reaction was measured as mm of the induration after 48–72 h of PPD injection. The vertical dotted line represents the TST cut-off (10 mm). Percent Concordant = 61%; Percent Discordant = 39%. Kappa = 0.152. SE of kappa = 0.092. Slight agreement.

