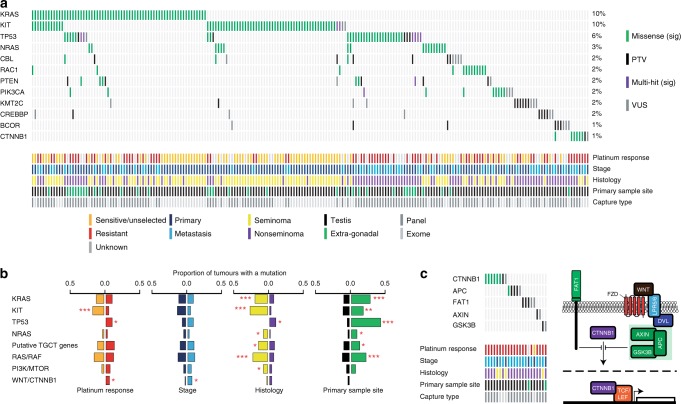
Fig. 3. Mutational landscape of cancer driver genes in TGCT.
a Oncoplot showing the cancer driver genes most frequently mutated across 631 index TGCTs from the full sample series (ICR1, ICR2, DFCI, TCGA, MSK and FDM). Only TGCTs carrying a mutation in one of the displayed genes are shown (n = 207). b Oncogenic mutation frequencies in individual genes/gene sets across index TGCTs with the relevant available data, comparing: platinum-sensitive/unselected (n = 284, orange) vs. platinum-resistant (n = 244, red) tumours; primary (n = 435, dark blue) vs. metastatic (n = 196, light blue) tumours; seminomas (n = 204, yellow) vs. nonseminomas (n = 417, purple); and testicular (n = 584, black) vs. extragonadal (n = 47, green) primary sample site. Asterisks denote p values derived from two-sided multivariable logistic regression, adjusting for platinum response, histology, stage, capture type, sample material and primary sample site.*p < 0.05, **p < 0.01, ***p < 0.001. Exact p values are provided in Supplementary Table 4. Putative TGCT genes: CBL, RAC1, PIK3CA, KMT2C, CREBBP, BCOR and CTNNB1. c WNT/CTNNB1 pathway alterations are overrepresented in platinum-resistant metastatic TGCTs (n = 22) with the majority consistent with pathway activation. Pathway components that negatively regulate CTNNB1 are shown in green.

