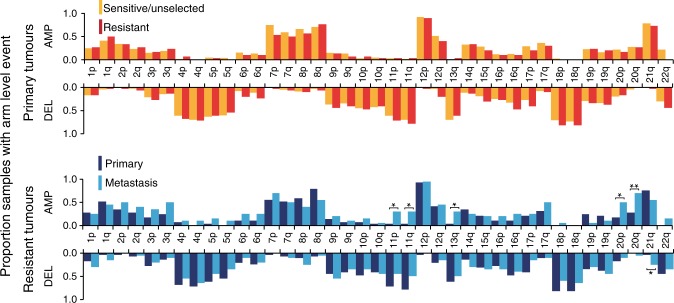
Fig. 4. Autosomal arm level aneuploidy frequencies.
The frequency of whole arm autosomal aneuploidy events in 183 TGCTs with available copy number data and tumour purity ≥ 0.4 from series ICR1, ICR2, DFCI and TCGA, comparing platinum-sensitive/unselected (orange, n = 134) vs. platinum-resistant (red, n = 29) primary TGCT, and comparing primary (dark blue, n = 29) vs metastatic (light blue, n = 20) platinum resistant TGCT (only a single representative metastatic tumour from each patient with platinum resistant TGCT was included-see Supplementary Data 7). Asterisks denote p values derived from two-sided multivariable logistic regression: *p < 0.05, **p < 0.01, Exact p values are provided in Supplementary Data 8.

