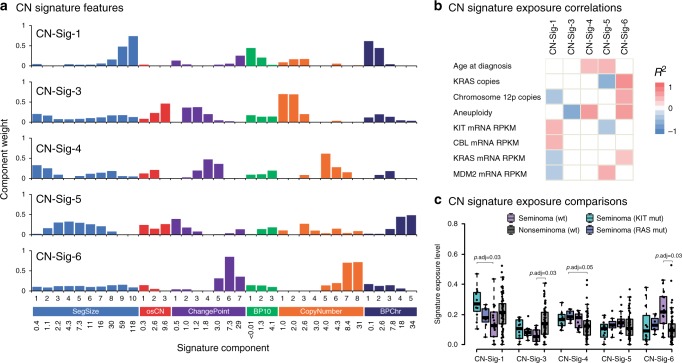
Fig. 7. TGCT copy number signatures.
Five copy number signatures (CN-Sig-1, CN-Sig-3, CN-Sig-4, CN-Sig-5, CN-Sig-6) identified using TCGA SNP array data (n = 105). a Defining features of the CN signatures, showing each feature (SegSize, osCN, ChangePoint, BP10, CopyNumber and BPChr) split into 36 constituent components, as defined in ref. 27. The mean value for each component is shown on the x axis, with component weights shown on the y axis. Features are defined as follows: SegSize, segment size (Mb); ocCN, region length with neighbouring oscillating copy number segments (Mb); ChangePoint, difference in copy number between neighbouring segments; BP10, number of break points (10 Mb−1), CopyNumber, absolute copy number of segment; BPChr, breakpoints per chromosome arm. b CN signature exposure correlations with clinical and molecular features. Two-sided Pearson’s correlations for association of q < 0.05 are illustrated. Age, aneuploidy and chromosome 12p copies: analysed across histologies. RAS pathway-related features: analysed in seminomas only. c Box plots showing CN signature exposure comparisons for KIT (n = 12) and RAS (n = 7, NRAS/KRAS) mutated seminomas, wildtype seminomas (n = 18) and nonseminomas (n = 66). Boxes show the median ± 25–75th percentiles, whiskers show 1.5× interquartile range below and above the 25th and 75th percentiles, respectively. p values are derived from two-sided Wilcoxon Rank Sum tests adjusted for multiple comparisons via the Benjamini-Hochberg method.

