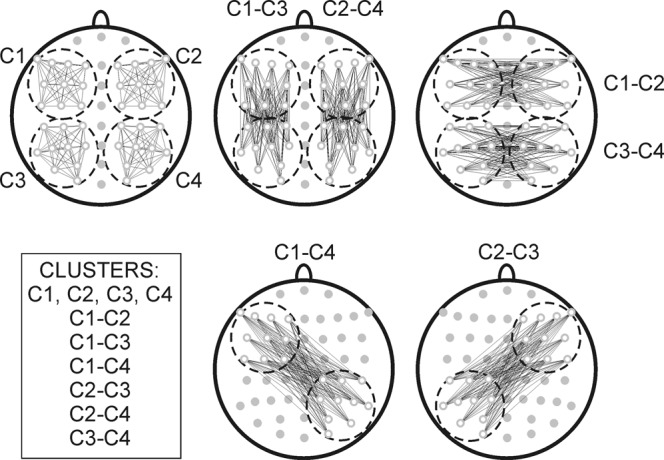
Figure 2.

Schematic presentations of electrodes (in grey) and clusters used for analyses marked as C1, C2, C3, C4, C1-C2, C3-C4, C1-C3, C2-C4, C1-C4, and C2-C3. Electrodes in C1: F7, F5, F3, F1, FC5, FC3, FC1, C5, C3, C1; Electrodes in C2: F8, F6, F4, F2, FC6, FC4, FC2, C6, C4, C2; Electrodes in C3: CP5, CP3, CP1, P7, P5, P3, P1, PO7, PO5, O1; Electrodes in C4: CP6, CP4, CP2, P8, P6, P4, P2, PO8, PO6, O2. Inter- and intra-hemispheric connectivity is reflected by cluster-based measures of ICoh (mean of all electrode pairs between C1 and C2 for C1-C2, mean between all electrode pairs between C1 and C3 for C1-C3, etc.).
