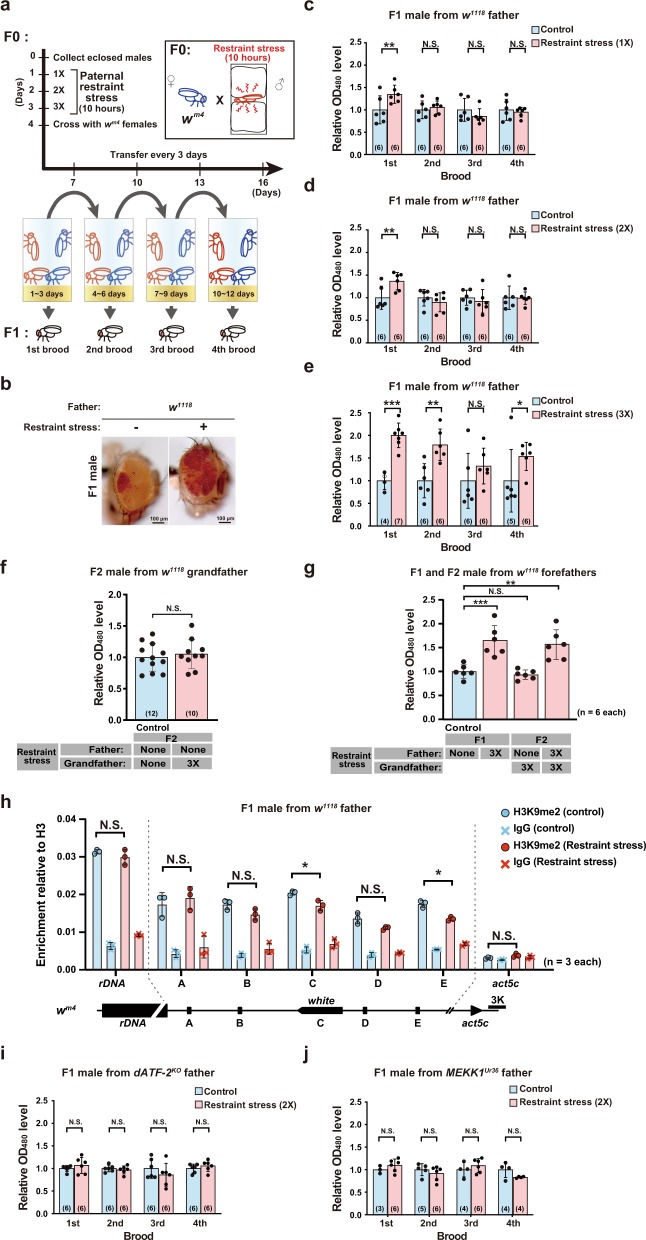
Fig. 1. Paternal restraint stress induces heterochromatin disruption in Drosophila offspring.
a Schematic diagram of the experimental design. The levels of red-eye pigment were measured in paternal restraint stress-exposed and paternal restraint stress-free (control) wm4 F1 progeny. w1118 males were exposed to restraint stress for 10 h per day, restraint stress treatment was repeated up to three times, and w1118 males were crossed with wm4 females. Parents were transferred to new vials every 3 days and removed from vials after 12 days. Red-eye pigment levels in F1 males from each brood were subsequently measured. b Eye phenotypes of F1 wm4 males derived from w1118 fathers with/without restraint stress. Red-eye pigment levels, measured as the absorbance/optical density (OD) at 480 nm, in F1 male progeny from fathers exposed to paternal restraint stress once (c), twice (d), or three times (e). The value of red-eye pigment represents relative to control of F1 male progeny, which derived from restraint stress-free fathers. Averages with standard deviation (s.d.) are shown (***p < 0.001; **p < 0.01; *p < 0.05; N.S., no significant difference, Student’s unpaired t test). f Red-eye pigment levels of F2 male derived from w1118 grandfather with/without restraint stress. g Red-eye pigment levels of F1 and F2 males derived from w1118 father and grandfather with/without restraint stress. h ChIP results performed using anti-H3K9me2, anti-H3, and control IgG. The value of y-axis represents the ratio of immunoprecipitated DNA with anti-H3K9me2 or control IgG to that with anti-H3 antibody. A diagram of the rearranged white locus on X chromosome is represented in the bottom panel, and target regions for ChIP assays are indicated in the diagram. Averages with s.d. are shown (*p < 0.05; N.S., no significant difference, multiple t-test). Red-eye pigment levels in F1 males derived from dATF-2KO (i) and d Mekk1Ur36 (j) fathers. Averages with s.d. are shown (N.S., no significant difference, Student’s unpaired t test). Number of samples analyzed indicated in parentheses on each graph. See also Supplementary Fig. 1.

