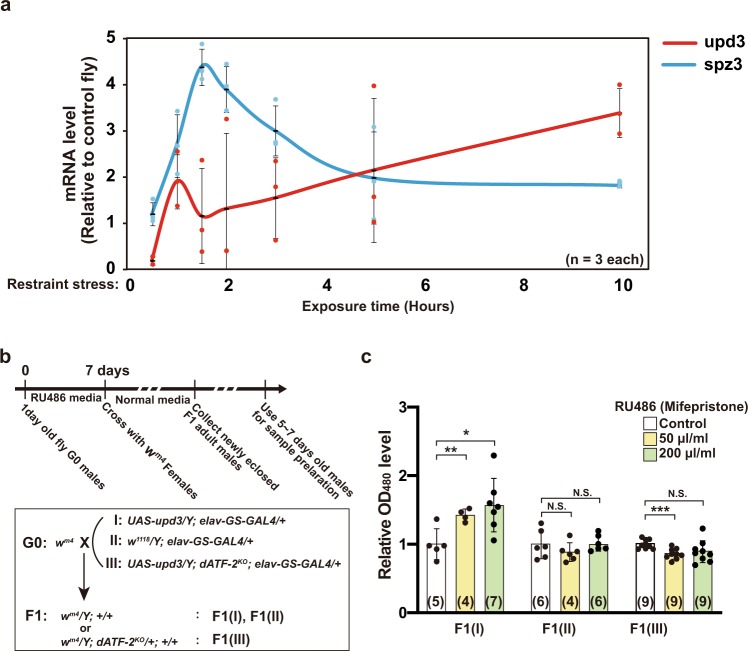
Fig. 6. Induction of upd3 by restraint stress, and heterochromatin disruption by paternal overexpression of upd3 in neuronal cells.
a Time course of upd3 and spz3 gene expression during restraint stress exposure for 10 h. The value of y-axis represents the ratio of mRNA levels of restraint stress-treated flies to that with control flies. Averages with s.d. are shown (n = 3 each). Note that the data are slightly different from that in Supplementary Fig. 7a, because the results were obtained by three biological replicative samples. b Schematic diagram of the experimental design. Newly eclosed virgin males of each genotype (I, upd3-inducible; II, upd3-non-inducible control; III, upd3-inducible dATF-2 mutant) were reared in RU486-containing medium and crossed with wm4 females. c Red-eye pigment levels in F1 males (I, II, and III) were then measured (right panel). Only F1(I) exhibited an RU486-dependent increase in red-eye pigment. Averages with s.d. are shown (***p < 0.001; **p < 0.01; *p < 0.05; N.S., no significant difference, Student’s unpaired t test). Number of samples analyzed indicated in parentheses on the graph. See also Supplementary Fig. 7.

