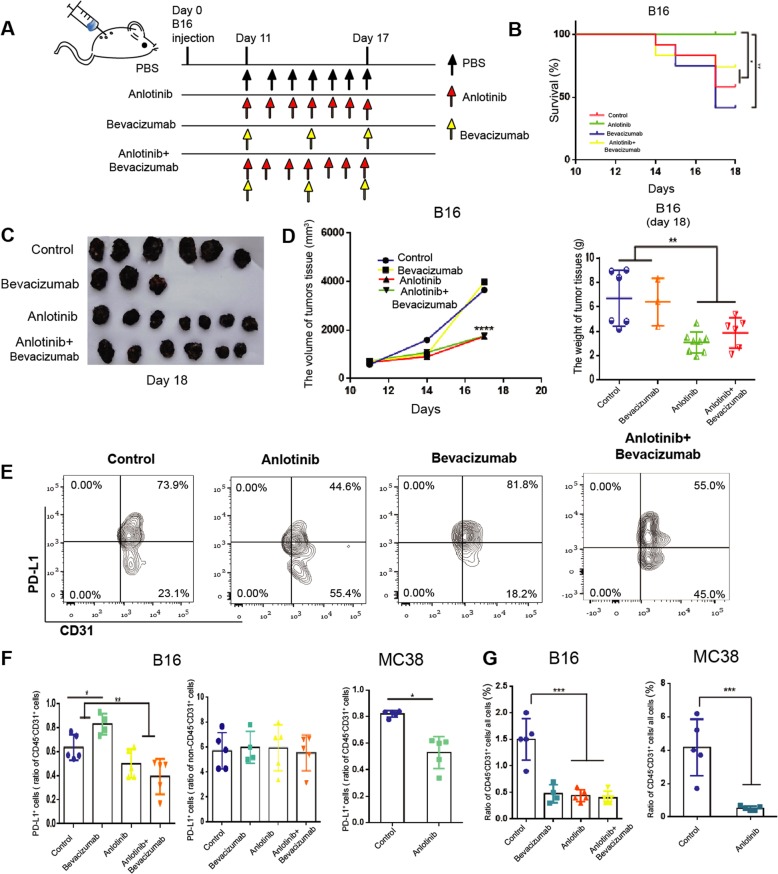
Fig. 5. anlotinib inhibits endothelial PD-L1 expression and inhibits tumor growth.
a C57BL/6 mice were injected with 1 × 10⁶ B16 cells and tumors grew. On day 11, mice were divided into four groups (n = 10 per group), and treated with bevacizumab, anlotinib, or both as shown. b Kaplan–Meier survival curves of B16 mice treated as indicated. c Representative images of B16 tumors in different groups. d Left: tumor growth curve of the various treatment groups; right: statistics of the weight of B16 tumors treated as indicated. e Representative flow images of CD31+ PD-L1+ cells taken from mice treated with anlotinib (n = 5), bevacizumab (n = 4), or both (n = 5). f Statistics of the percentage of CD31+ PD-L1+ cells in the B16 or MC38 tumors and the percentage of PD-L1+ non -VECs in B16 tumors. g Statistics of the percentage of CD45−CD31+ cells in the B16 or MC38 tumors. Data are mean ± SD. *P < 0.05, **P < 0.01, ***P < 0.001, ****P < 0.0001, Student’s t test.

