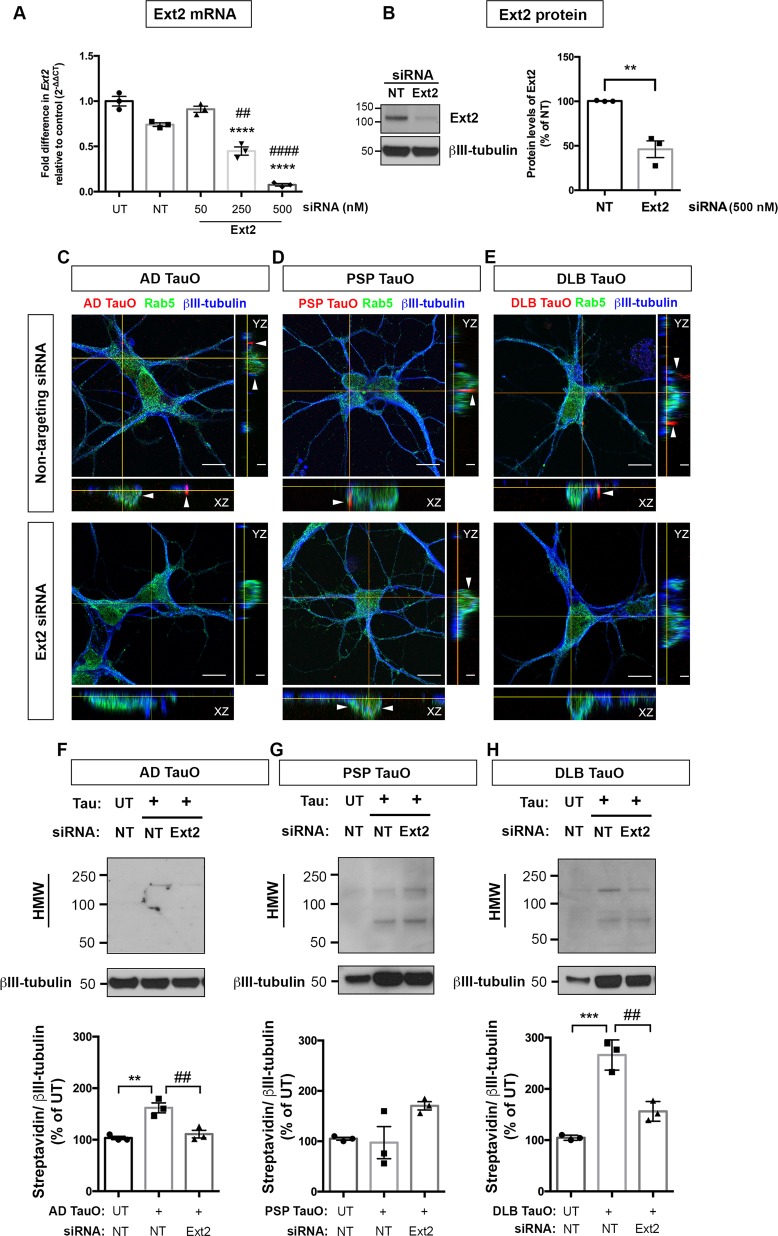
Fig. 4. Exostosin-2 knockdown prevented internalization and accumulation of extracellular tau species in neurons.
a, b Primary neurons (DIV2) were applied AccellTM SMARTpool siRNA for non-targeting (NT) or Ext2 gene (NM_001355075) at concentrations of 50–500 nM for 96 h. 18s rRNA was used for the reference gene and normalization in gene expression analysis. Ext2 siRNA (500 nM) significantly reduced the exostosin-2 mRNA (a) and protein (b) levels compared with NT siRNA. Results were from three independent experiments and shown as fold difference expression relative to control (mean ± SEM). Statistical analyses were measured by one-way ANOVA with Tukey’s test (a) or unpaired, two-tailed Student’s t test (b) from three biological independent experiment. Results showed as the value of mean ± SEM, a ****p < 0.0001 vs UT group, ##p < 0.01, ####p < 0.0001 vs NT group, b **p < 0.01 vs NT group. c–e Neurons (DIV2) were preincubated with NT or Ext2 siRNA for 96 h followed by AF568-tagged TauO from AD (c), PSP (d), or DLB (e) treatment for 18 h. Cells were immunolabeled with a mature neuronal marker (βIII-tubulin, blue), and an early endosomal marker (Rab5, green). Representative orthogonal images depicted AF568-tagged TauO co-localized to early endosomes (arrows). Scale bar: 2 and 10 μm. f–h Neurons were untreated (UT) or treated with 0.1 μM biotin-tagged TauO (+) from AD (f), PSP (g), or DLB (h) with similar experimental conditions and parameters as for (c–e). Internalized tau was detected using anti-Streptavidin antibody. Representative Western blot images depicted the appearance of exogenously applied TauO. Internal controls from the same blot were probed with anti-βIII-tubulin. Analysis of internalized tau levels was on the lower panel of each immunoblot showing as Streptavidin band intensity (HMW: 75–250 kDa) normalized to internal control and presented as the percentage of UT group. Statistical analyses were measured by one-way ANOVA with Tukey’s test from three biological independent experiments. Results showed as the value of mean ± SEM, **p < 0.01, ***p < 0.001 vs UT group. ##p < 0.01 vs TauO-treated group. Western blot analyses of TauO from AD, PSP, or DLB were performed on separate membranes. The same membranes were re-probed for marker proteins of autophagy–lysosomal pathway as shown in Fig. 5a–c. The immunoblots for internal controls shown in Fig. 4f–h were reused in Fig. 5a–c.

