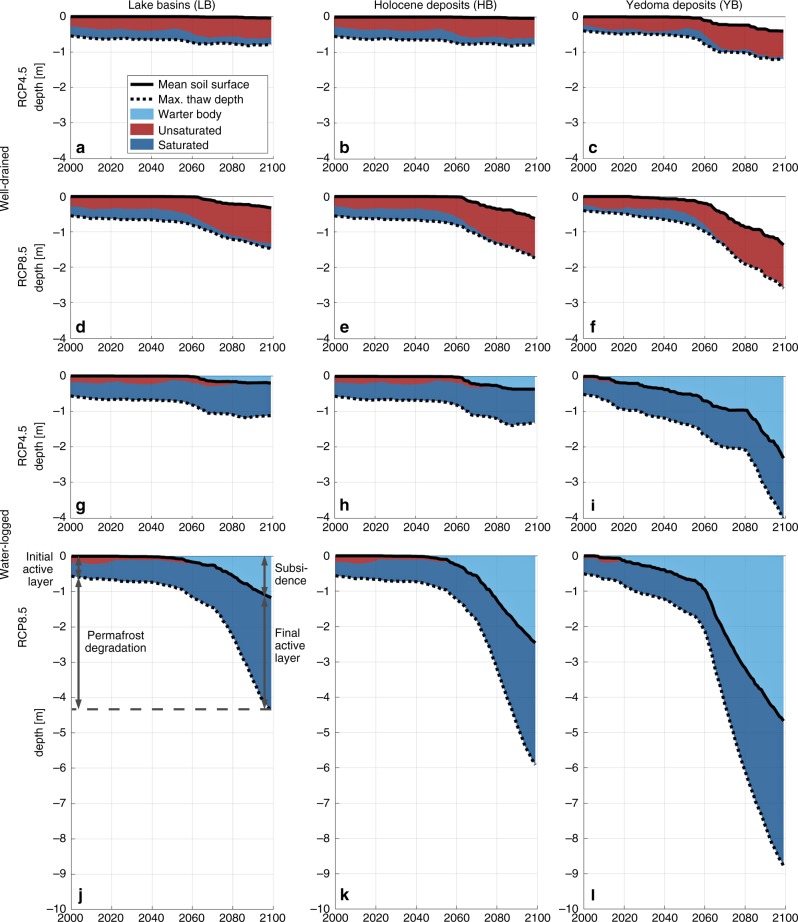
Fig. 3. Simulated permafrost degradation and ground saturation.
The panels a to l show the accumulated mean ground subsidence and 11-year running mean of the maximum annual thaw depth for all settings (area-weighted means of the three tiles). Coloured areas indicate the fractions of unsaturated (red) and saturated (dark blue) conditions prevailing in the thawed ground throughout each year. Under water-logged conditions, surface water bodies form atop subsiding ground (light blue). Both ground subsidence and active-layer deepening cause permafrost degradation (see illustration in panel j). Corresponding plots for the reference runs without excess ice and the RCP2.6 runs are provided in Supplementary Figs. 6 and 7.

