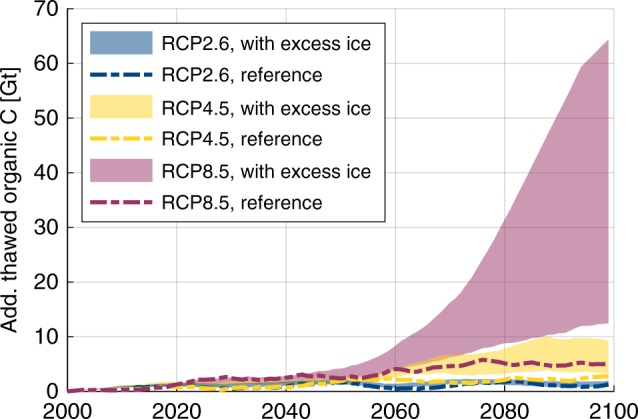
Fig. 4. Projection of thaw-affected organic carbon stocks.

The estimates were obtained by scaling the simulation results using representative stratigraphies and the total areal extent of each landscape type within the northeast Siberian lowlands (see “Methods”). For each warming scenario, the indicated ranges correspond to 11-year running means of the annual maximum of thawed organic carbon under contrasting hydrological conditions. The reference runs without excess ice reflect the simplistic representation of permafrost in ESMs.
