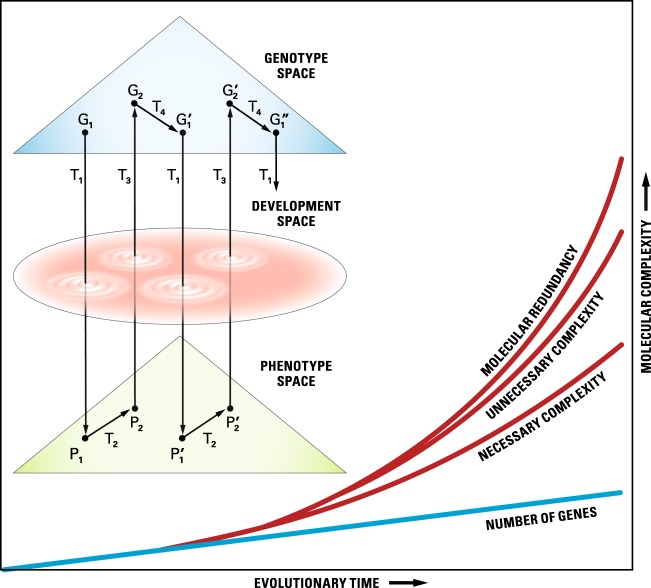
Fig. 1. Schematic representation of genotype-phenotype transformation from one generation to the next.
G and P are the spaces of the genotypic and phenotypic description. G1, G′1, G2, and G′2 are genotypic descriptions at various points in time within successive generations. P1, P′1, P2, and P′2 are phenotypic descriptions. T1, and T3 are laws of transformation from genotype to phenotype and back, respectively, during development. T2 are laws of population biology, and T4 are laws of Mendel and Morgan about gamete formation. Necessary and unnecessary complexities and molecular redundancy are defined in the text. (After Lewontin19). The graph lines are not intended to mean monotonic increase.

