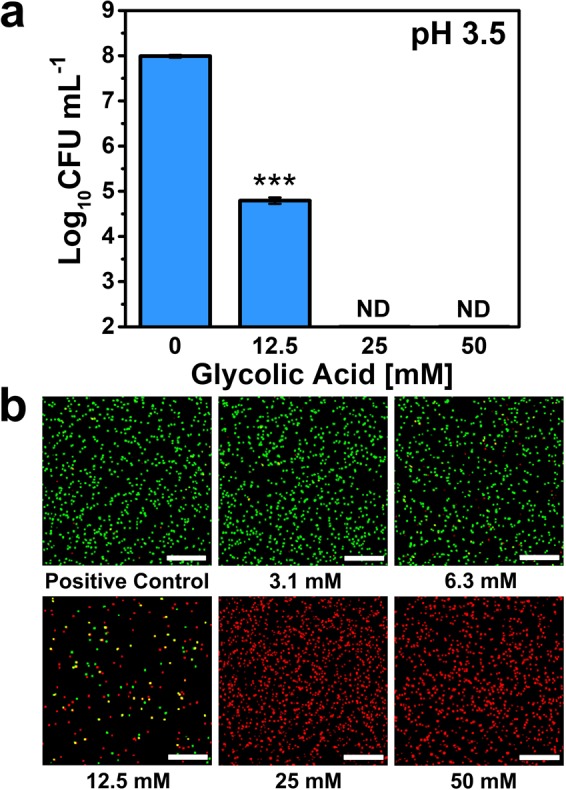
Figure 3.

Effect of glycolic acid treatment on C. acnes cell viability. (a) Effect of glycolic acid concentration-dependent treatment on viable C. acnes cell concentration at pH 3.5. The C. acnes cell concentration was 1 × 10⁸ CFU mL−1. The recorded MBC value was 25 mM, and corresponds to the lowest glycolic acid concentration at which no bacterial cell viability was detected (reported as ND, not determined). Mean ± standard deviation values are reported from n = 3 experiments. (b) Live-dead assay evaluation of glycolic acid-treated C. acnes cells at different glycolic acid concentrations by confocal laser scanning microscopy (CLSM) imaging. Green and red colors indicate live and dead C. acnes cells, respectively. Images are representative of three experiments. Scale bars: 100 μm.
