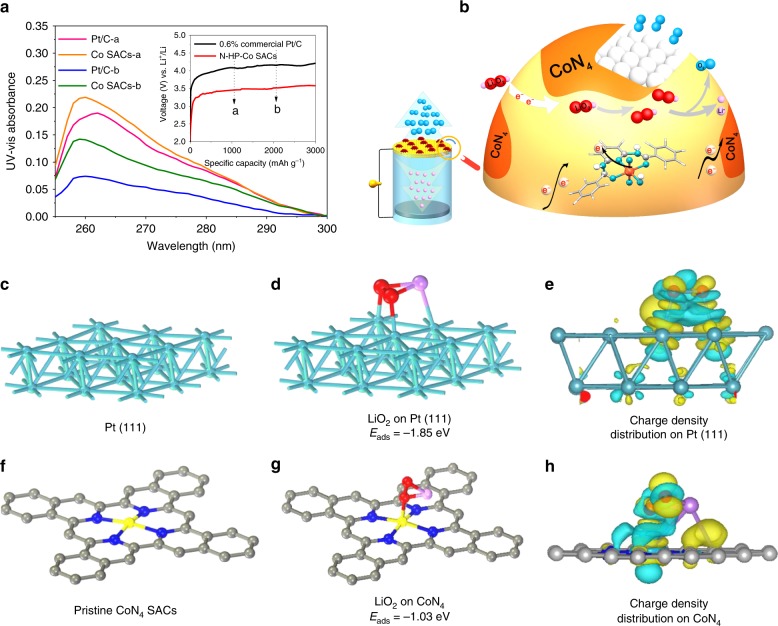
Fig. 5. Charge characterization.
a UV-vis spectra of DMSO-extracted superoxide products from the 0.6% commercial Pt/C and N-HP-Co SAC cathodes at different charging states (a state a, charge to 1000 mAh g−1; b state b, charge to 2000 mAh g−1). The inset of a shows the corresponding charge potential profiles of the Li−O2 cells using 0.6% commercial Pt/C and N-HP-Co SACs at a current density of 100 mA g−1. b Schematic illustration showing the charge mechanisms of the N-HP-Co SAC-catalysed Li–O2 batteries. c, d Pristine and top views of the optimized structures with the corresponding binding energy of LiO2 on Pt (111); f, g optimized structure and the corresponding binding energy of LiO2 on CoN4; and e, h corresponding charge density distribution. Colour code: platinum (green), carbon (grey), CoN4 (blue), and LiO2 (red).

