
Figure 4.
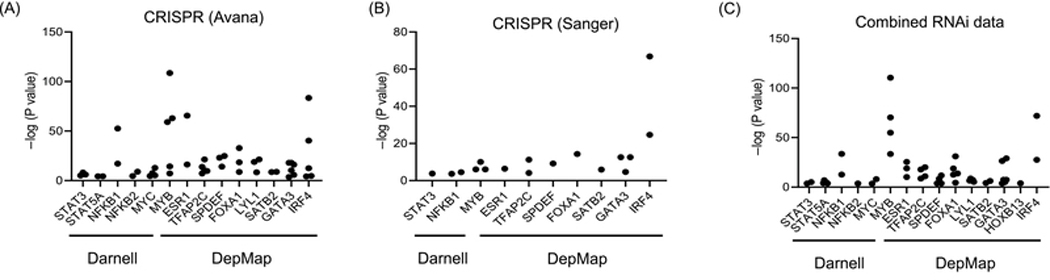
Significance of tissue specificity for targets nominated by the dependency map project. –log (P values) for P values computed between cancer cell lines of a specific type and all other cancer cell lines using empirical Bayes statistics. Data points were selected in October 2019 from specific types that were statistically different and more dependent than the rest of the cancer cell lines, using (A) CRISPR (Avana) data, (B) CRISPR (Sanger) data and (C) combined RNAi data from the Broad, Novartis, and Marcotte.