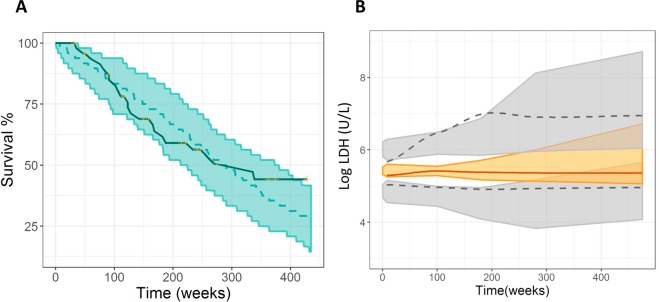
Figure 3.
Model evaluation: Visual Predictive Checks. (A) Kaplan Meier plot of OS probability. The solid blue line represents raw data while the blue shaded area cover the 95% prediction interval calculated from 1000 simulated studies. (B) VPC of the selected biomarker model. Median (solid line), and percentiles (dashed lines) of the observed data. 95% confidence Intervals for median (shaded colored area), and percentiles (shaded grey areas) of the simulated data.

