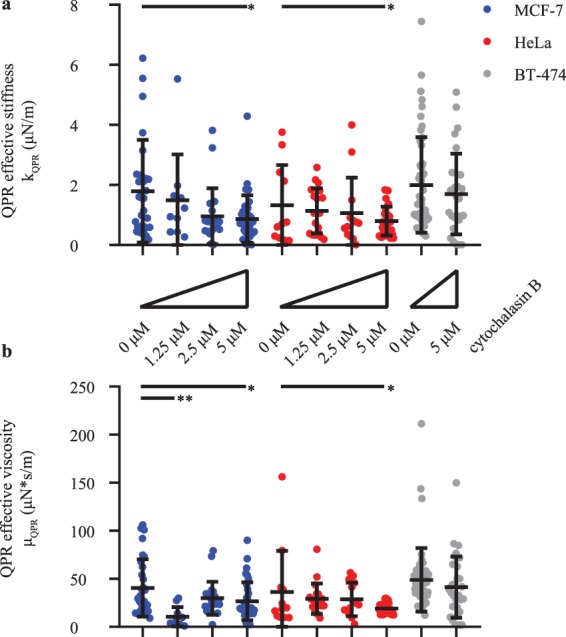
Figure 3.

Population average QPR stiffness and viscosity values decrease with increasing cytochalasin B concentration. (a) QPR stiffness and (b) QPR viscosity of MCF-7, HeLa, and BT-474 over various 0-10 μM cytochalasin B concentration. QPR samples were collected at 0 μM (n = 12), 1.25 μM (n = 20), 2.5 μM (n = 14), and 5 μM (n = 25) for HeLa, at 0 μM (n = 31), 1.25 μM (n = 11), 2.5 μM (n = 22), and 5 μM (n = 34) for MCF-7, and at 0 μM (n = 51) and 5 μM (n = 31) for BT-474 cells. Error bars represent SD. * p < 0.05 and ** p < 0.01.
