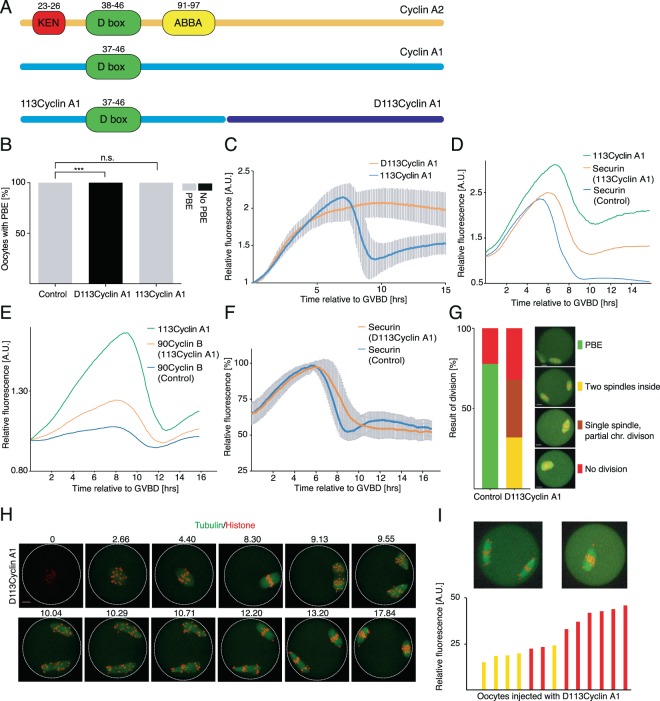
Figure 3.
Fragment of cyclin A1 which contains D-box is not efficiently targeted for degradation and alters dynamic of degradation of other APC substrates. (A) Schematic comparison of cyclin A1 and cyclin A2 and the relative positions of sequence motives (D-box, KEN box, ABBA motive) related to the ubiquitination and degradation of the molecule on proteasome. (B) Scoring of PBE in control oocytes (n = 8) and oocytes injected with either 113cyclin A1 (n = 12) or D113cyclin A1 (n = 12) cRNAs. Grey bars represent oocytes with underwent PBE (control 100%, 113cyclin A1 100% and D113cyclin A1 0%), black bars represent oocytes arrested in meiosis I. The data were obtained from two independent experiments. The difference between control oocytes and oocytes injected with D113cyclin A1 cRNA was statistically significant (α < 0.05; ***P < 0.0001). The difference between control oocytes and oocytes injected with 113cyclin A1 cRNA was not statistically significant (α < 0.05; P > 0.9999). (C) Relative expression curves of 113cyclin A1 (blue, n = 12) and D113cyclin A1 (orange, n = 12) during oocyte meiosis. GV oocytes were injected with histone and cyclin A1 cRNAs fragments fused to fluorescent proteins. The fluorescence was measured overnight using confocal time lapse microscopy. Signal in each cell was normalized to the level at GVBD and the average curves are shown together with standard deviation values at each time point. The data were obtained from two independent experiments. (D) Relative expression curves of securin in control cells (blue, n = 11), of securin in cells co-injected with cRNA encoding 113cyclin A1 (orange, n = 17) and relative expression curve of 113cyclin A1 itself (green, n = 17). The fluorescence was measured overnight using confocal time lapse microscopy, the signal in each cell was normalized to the level at GVBD. The average curves are shown for each time point. The data were obtained from two independent experiments. (E) Relative expression curves of 90cyclin B1 in control cells (blue, n = 16), and in cells co-injected with cRNAs encoding 90cyclin B1 and 113cyclin A1 (orange, n = 14) and relative expression curve of 113cyclin A1 itself (green, n = 14). The fluorescence was measured overnight using confocal time lapse microscopy, the signal in each cell was normalized to the level at GVBD. The average curves are shown for each time point. The data were obtained from two independent experiments. (F) Relative expression curves of securin in control cells (blue, n = 14) and in cells co-injected with cRNAs encoding securin and D113cyclin A1 (orange, n = 25). The fluorescence was measured overnight using confocal time lapse microscopy, the signal in each cell was normalized to the level at GVBD. The average curves, together with standard deviations are shown for each time point. The data were obtained in three independent experiments. (G) Scoring of spindle division phenotypes in oocytes injected with histone and tubulin cRNAs fused to fluorescent proteins. The frequency of each phenotype is indicated for control cells (n = 18; PBE 78%, no division 22%) and for cells injected with D113cyclin A1 cRNA (n = 25; two spindles inside 32%; internal spindle and partial chr. division 36%; no division 32%). The data were obtained in three independent experiments. Scale bar represents 10 μm. (H) Frames from time lapse movie of oocyte co-injected with cRNAs encoding histone, tubulin and D113cyclin A1. Scale bar represents 10 μm. (I) Chart demonstrating a dependency of expression levels of D113cyclin A1 on chromosomes and spindle division. GV oocytes were injected with cRNAs encoding histone and tubulin fused to fluorescent proteins and with various amount of D113cyclin A1 cRNA diluted in water containing fluorescently labelled dextran, allowing to quantify the amount of D113cyclin A1 in each individual cell. Presented are data from one experiment.

