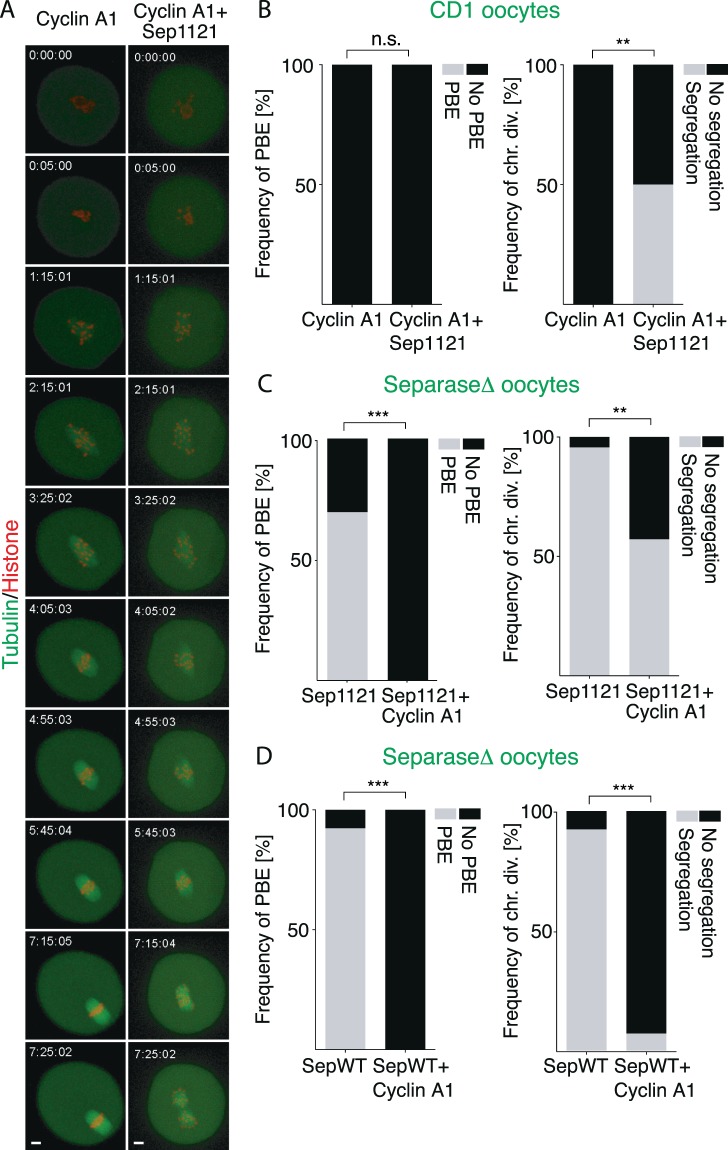
Figure 4.
Cyclin A1 directly inhibits activity of separase. (A) Frames from confocal live cell imaging experiment of CD1 strain oocyte co-injected with cRNAs encoding histone (red) and tubulin (green) and cyclin A1 (without florescent tag). Oocyte showed on the right was co-injected also with separase mutated to alanine on position 1121. Scale bar represents 10 μm. (B) CD1 oocytes were injected with histone and tubulin fused to fluorescent proteins and also with cyclin A1 (n = 16) or cyclin A1 together with separase1121 (n = 16). Polar body extrusion (PBE) and chromosome segregation were then assessed by time lapse confocal microscopy. The left chart shows frequency of PBE in each group (both groups 0% PBE). The right chart shows the frequency of chromosomes segregation in each group (cyclin A1 0%, cyclin A1 + Sep1121 50%). The data were obtained from two independent experiments. The difference between oocytes microinjected with cyclin A1 and oocytes co-injected also with separase1121 in frequency of PBE was not statistically significant (α < 0.05; P > 0.9999). The difference between oocytes microinjected with cyclin A1 and oocytes co-injected also with separase1121 in frequency of chromosome division was statistically significant (α < 0.05; **P = 0.0024). (C) Separase Δ oocytes were injected with histone fused to fluorescent protein and with separase 1121 (n = 23) or separase 1121 together with cyclin A1 (n = 30). PBE and chromosome segregation were assessed by time lapse confocal microscopy. The left chart shows frequency of PBE in each group (separase 1121 70% PBE, separase1121 + cyclin A1 0% PBE). The right chart shows the frequency of chromosomes segregation in each group (separase 1121 96%, separase 1121 + cyclin A1 60% of chromosomes segregated). The data were obtained from three independent experiments. The difference between separase Δ oocytes microinjected with separase 1121 and separase Δ oocytes co-injected also with cyclin A1 in frequency of PBE was statistically significant (α < 0.05; ***P < 0.0001). The difference between separase Δ oocytes microinjected with separase1121 and separase Δ oocytes co-injected also with cyclin A1 in frequency of chromosome division was statistically significant (α < 0.05; **P = 0.0033). (D) Separase Δ oocytes were injected with histone fused to fluorescent protein and with wild type separase (separase WT, n = 13) or wild type separase together with cyclin A1 (n = 14). The left chart shows frequency of PBE in each group (separase WT 92% PBE, Separase WT + cyclin A1 0% PBE) and the right chart the frequency of chromosome segregation in each group (separase WT 92%, separase WT + cyclin A1 7%). The data were obtained from two independent experiments. The difference between separase Δ oocytes microinjected with separase WT and separase Δ oocytes co-injected also with cyclin A1 in frequency of PBE was statistically significant (α < 0.05; ***P < 0.0001). The difference between separase Δ oocytes microinjected with separase WT and separase Δ oocytes co-injected also with cyclin A1 in frequency of chromosome division was statistically significant (α < 0.05; ***P < 0.0001).

