Figure 5.
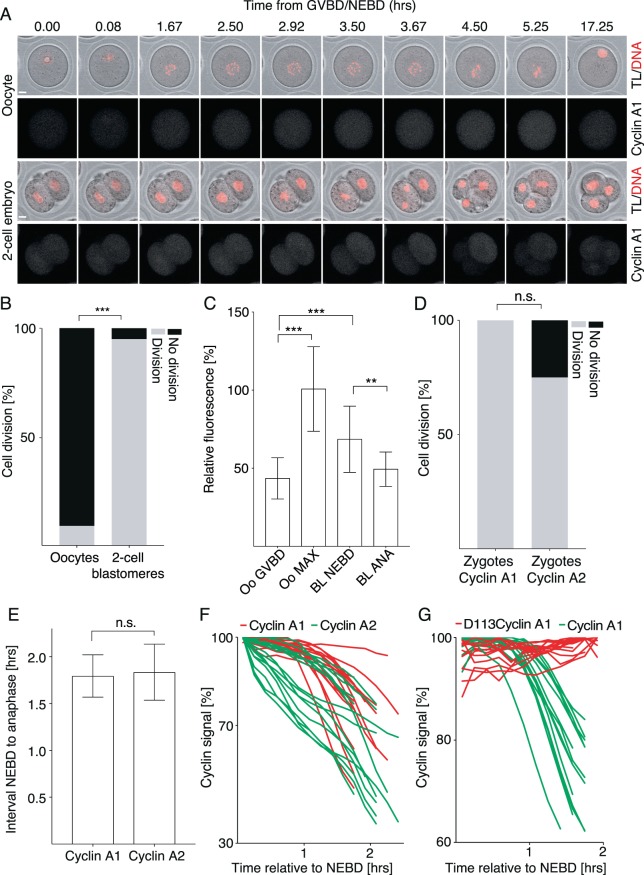
Expression of cyclin A1 does not prevent anaphase in zygotes and 2-cell embryos. (A) Frames from the time lapse experiment showing comparison between oocyte (upper panel) and 2-cell embryo (lower panel). Both oocytes and embryos were microinjected with cRNAs encoding histone and cyclin A1 fused to fluorescent proteins. Cell division and chromosome segregation were then assessed by time lapse confocal microscopy. Scale bar represents 10 μm. (B) Scoring of cell division of oocytes (n = 22) and 2-cell blastomeres (n = 42) described in panel (A). Cells which divided (oocytes 9%, embryos 95%) are indicated by grey bars and cell with no division (oocytes 91%, embryos 5%) observed during the duration of experiment are as black bars. The data were obtained from three independent experiments. The difference between oocytes and 2-cell blastomeres was statistically significant (α < 0.05; ***P < 0.0001). (C) Relative fluorescence signal of cyclin A1 in indicated cells and time intervals. GV oocytes – the relative fluorescence signal was measured in the first frame after GVBD (Oo GVBD, 43.24 AU) and in the frame of maximum fluorescence (Oo MAX, 102.6). 2-cell blastomeres – the relative fluorescence signal was measured in the first frame after NEBD (BL NEBD, 63.97 AU) and in the first frame of anaphase (BL ANA, 44.76). The difference between Oo GVBD and Oo MAX was statistically significant (α < 0.05; ***P < 0.0001), the difference between Oo GVBD and BL NEBD was statistically significant (α < 0.05; ***P < 0.0007) and the difference between BL NEBD and BL ANA was statistically significant (α < 0.05; **P < 0.0011). (D) Zygotes were microinjected with cRNAs encoding histone and either cyclin A1 (n = 13) or cyclin A2 (n = 12) fused to fluorescent proteins. Cell division was then assessed by time lapse confocal microscopy. Cells which divided (cyclin A1 100%, cyclin A2 75%) are indicated by grey bars and cell with no division (cyclin A1 0%, cyclin A2 25%) observed during the duration of experiment are as black bars. The data were obtained from two independent experiments. The difference in division between zygotes was not statistically significant (α < 0.05; P = 0.0957). (E) The length of the interval between disassembly of the nuclear membrane (NEBD) and anaphase was measured in cells described in panel (C). Average time interval between NEBD and anaphase was 1.79 h for cells injected with cyclin A1 cRNA and 1.83 h for cells injected with cyclin A2 cRNA. The data were obtained from two independent experiments. The difference between the length of mitosis in cells injected with cyclin A1 and cyclin A2 were not significant (α < 0.05; P = 0.7254). (F) The levels of fluorescence signal of cyclin A1 (red, n = 16) and cyclin A2 (green, n = 16) during mitotic division of zygotes. The signal in each cell from NEBD to anaphase is shown as individual curve. The signal was normalized to the maximum level. The data were obtained in two independent experiments. (G) The levels of fluorescence signal of D113cyclin A1 (red, n = 16) and cyclin A1 (green, n = 14) during mitotic division of zygotes. Individual curves for each analyzed cell. The signal in each cell from NEBD to anaphase is shown as individual curve. The signal was normalized to the maximum level. The data were obtained from two independent experiments.

