Fig. 3.

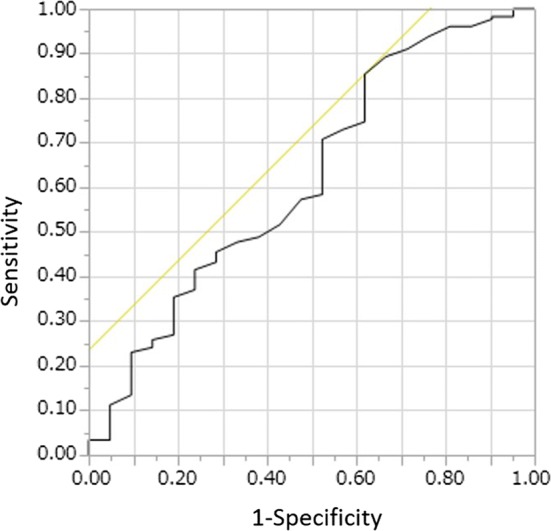
The ROC curve for predicting CRT responders. The QRSd of 114 ms was a cutoff for predicting CRT responders, with an area under the curve (AUC) of 0.62

The ROC curve for predicting CRT responders. The QRSd of 114 ms was a cutoff for predicting CRT responders, with an area under the curve (AUC) of 0.62