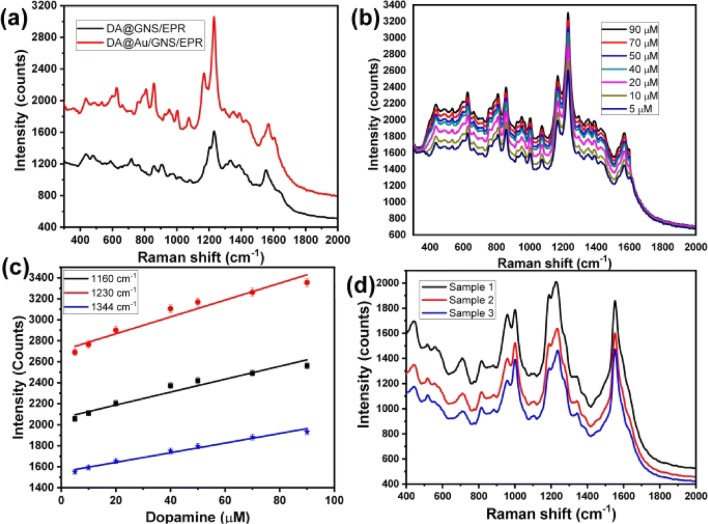
Fig. 8.
Raman spectra of dopamine solution in PBS buffer by using GNS/EPR5 and Au NPs/GNS/EPR5 (a), G-SERS spectra of different concentrations of dopamine dissolved in PBS buffer by using Au NPs/GNS/EPR5 (b), the relationship between the intensities of SERS signals (857, 1074 and 1344 cm−1) and the corresponding concentration of dopamine (c), and G-SERS spectra of different concentrations of dopamine dissolved in human serum by using Au NPs/GNS/EPR5 (d)

