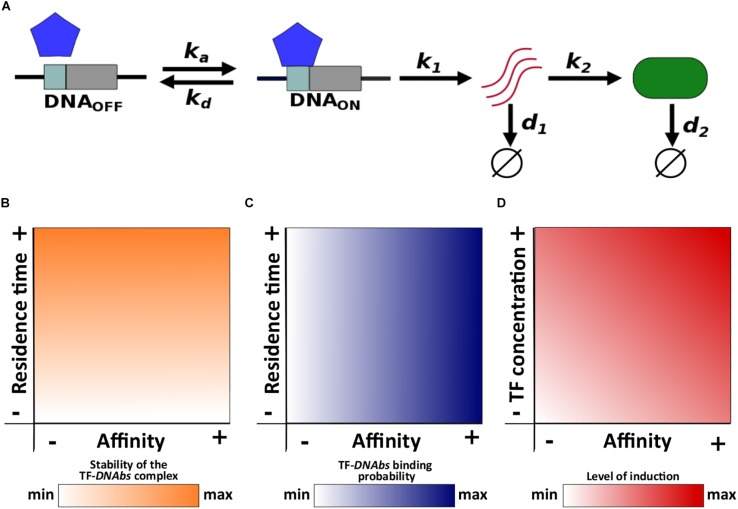
FIGURE 1.
Schematic description of the model and main concepts. (A) ka and kd correspond to the association and dissociation rate, respectively; k1 and k2 correspond to the mRNA and protein synthesis rate, respectively; d1 and d2 correspond to the mRNA and protein degradation rate, respectively. Relationships of both residence time and affinity with (B) the stability of the TF-DNAbs complex, and (C) TF-DNAbs binding probability. (D) Relationship of affinity and TF concentration with the level of induction.

