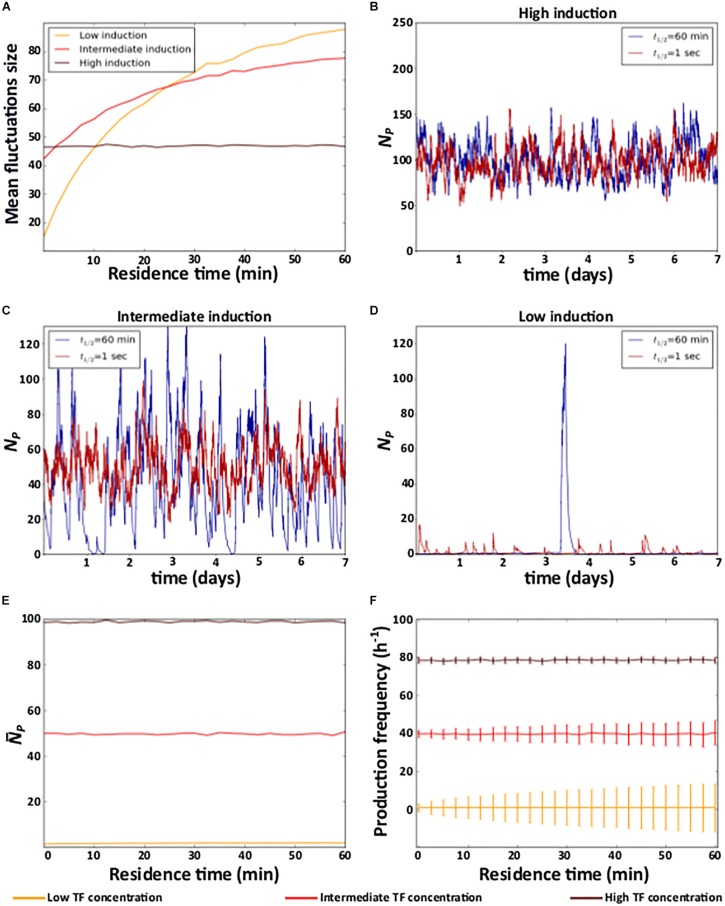
FIGURE 2.
Residence time and noise. (A) Mean fluctuation size in the number of protein molecules (y axis) at different levels of induction as a function of residence time (x axis). (B–D) Example time trajectories of the number of protein molecules NP at three different levels of induction. Analyses of (E) mean number of protein () (F) mean and coefficient of variation of the frequency of protein production events. (B–D) Red and blue lines show data for short (1 s) and a long (1 h) residence times, respectively. (A,E,F) High (TF = 10–7M), intermediate (TF = 10–9M), and low (TF = 10–11M) levels of induction are indicated in the color legend below the figure.

