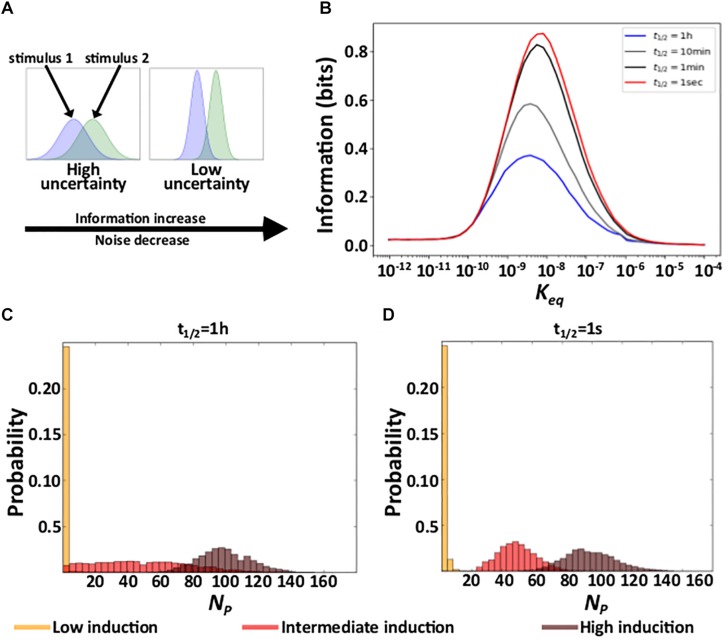
FIGURE 3.
Residence time and information. (A) Schematic explanation of the relationship between noise and acquired information. The panel shows hypothetical response protein distributions produced by two different stimuli at a high (right) and a low (left) level of gene expression noise. (B) Acquired information at different residence times as a function of the affinity (Keq) between TF molecules and DNA. (C,D) Distributions of the number of expressed proteins NP at three different TF concentrations (see color legend) with a long (C), and a short (D) residence time. In (C) and (D), Keq = 10–9M.

