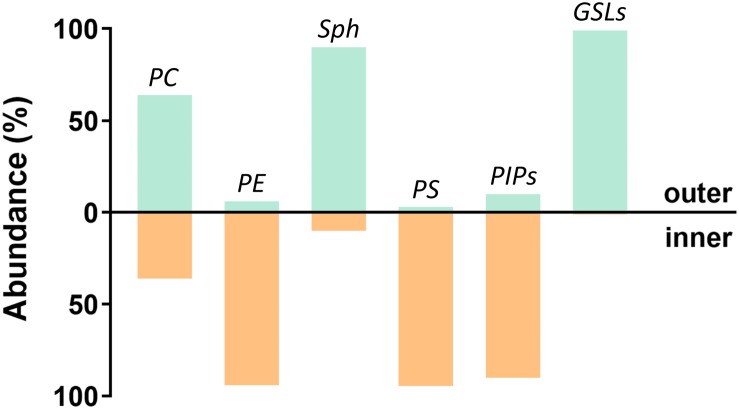
FIGURE 6.
Plasma membrane asymmetry. Schematic representation of the plasma membrane lipid composition. Distribution in both leaflets is depicted as a percentage of the total lipid class. Based on (Zachowski, 1993; Lingwood, 2011; Fujimoto and Parmryd, 2017).

