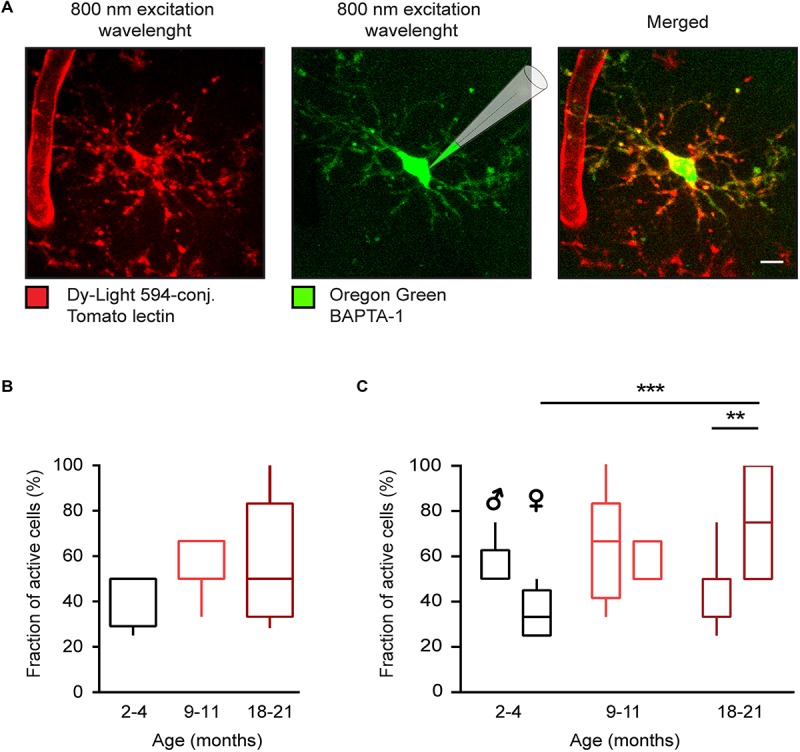
FIGURE 1.

Age-dependent changes of in vivo microglial Ca2 + signaling in WT mice. (A) Maximum intensity projection (MIP) images (110–126 μm below the cortical surface, here and below the step size is 1 μm) of a representative microglial cell in a WT mouse labeled with the DyLight 594-conjugated Tomato lectin (left) and loaded with the small molecule Ca2 + indicator Oregon Green BAPTA-1 (OGB-1) by means of single-cell electroporation (middle). Merged image is shown on the right. (B) Box-and-whisker plot illustrating the fractions (per mouse) of spontaneously active microglia in 2–4- (n = 11 mice, 39 cells), 9–11- (n = 10 mice, 34 cells), and 18–21- (n = 14 mice, 46 cells) month-old mice. (C) Box-and-whisker plot illustrating the effect of the age and sex on the fraction (per mouse) of spontaneously active microglia [n = 5 males (16 cells), 6 females (23 cells) for 2–4 months old mice; 5 males (18 cells), 5 females (16 cells) for 9–11 months old mice and 7 males (23 cells), 7 females (23 cells) for 18–21 months old mice]. Statistical differences were determined using two-way ANOVA followed by Bonferroni’s post hoc test (**p < 0.01 and ***p < 0.001). Scale bar, 5 μm.
