FIGURE 2.

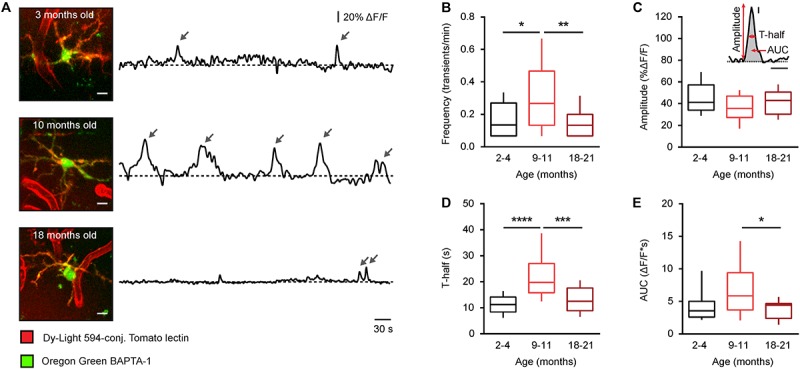
Age-dependent changes of the time course of somatic Ca2 + signals in microglia from WT mice. (A) MIP images of representative microglial cells from 2– 4-, 9– 11-, and 18–21-month-old mice (left; 82–103 μm, 73–97 μm, and 65–87 μm below the cortical surface, respectively) as well as spontaneous Ca2 + transients (arrows) recorded from these cells in vivo during a 15-min-long recording period (right). Scale bar, 5 μm. (B–E) Box-and-whisker plots illustrating the median (per cell) frequency (B), amplitude (C), T-half (D), and AUC (E) of spontaneous Ca2 + transients in microglia from 2–4- (n = 19 cells), 9–11- (n = 19 cells), and 18–21- (n = 28 cells) month-old mice. Inset in (C) shows an example of a Ca2 + transient and schematically illustrates the parameters analyzed for each Ca2 + transient. Inset scale bars, 5% ΔF/F and 10 s. Statistical differences were determined using Kruskal-Wallis test followed by Dunn’s post hoc test for multiple comparisons (*p < 0.05, **p < 0.01, ***p < 0.001, and ****p < 10−4).
