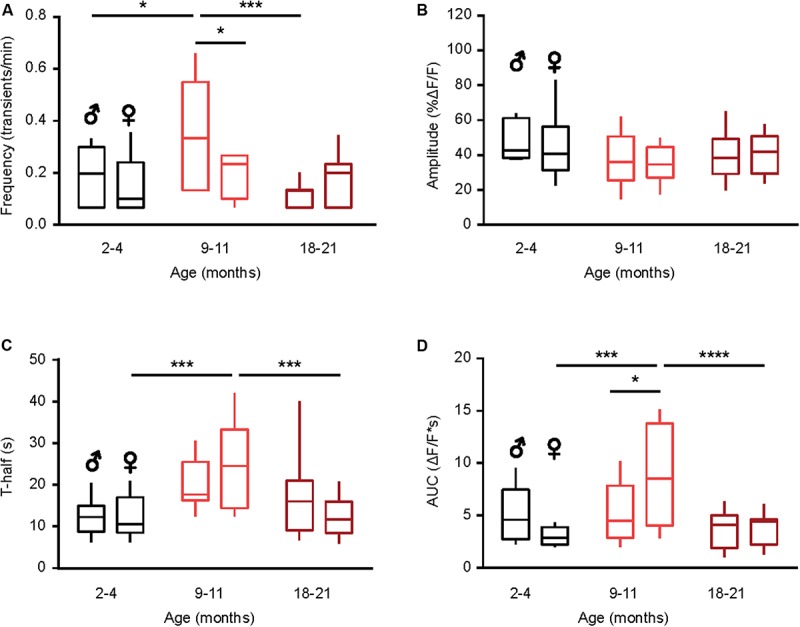
FIGURE 3.

Sex-specificity of the time course of spontaneous Ca2 + transients and its dependence on animal‘s age. (A–D) Box-and-whisker plots illustrating the effect of age and sex on the median (per cell) frequency (A), amplitude (B), T-half (C) and AUC (D) of the spontaneous Ca2 + transients in microglia [n = 9 cells (males), 10 cells (females) for 2–4 months old mice; 10 cells (males), 9 cells (females) for 9–11 months old mice and 10 cells (males), 18 cells (females) for 18–21 months old mice]. Statistical differences were determined using two-way ANOVA followed by Bonferroni’s post hoc test (*p < 0.05, ***p < 0.001, and ****p < 10–4).
