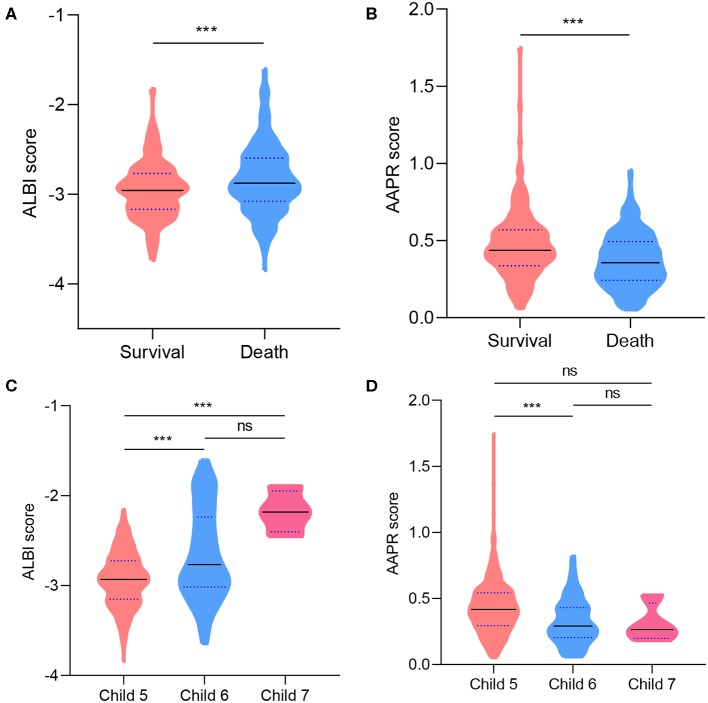
Figure 1.
Violin plots showing the distribution of ALBI and AAPR score: in survival and death group at the end of follow-up (A,B); for patients with different Child–Pugh scores (C,D). Solid lines represent median value; dotted lines represent quartiles. *P < 0.05; **P < 0.01; ***P < 0.001; ns, not significant.

