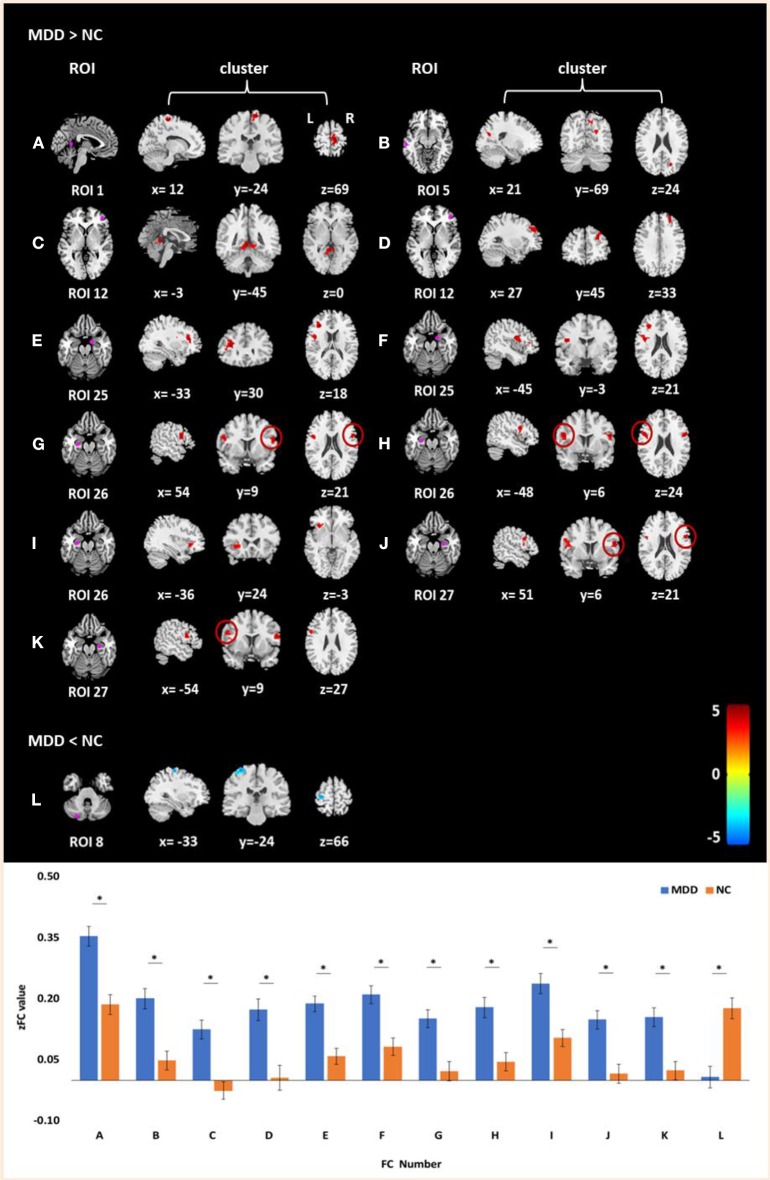
Figure 1.
Clusters of between-group differences of FC with age, gender, education level, and center adjusted (P < 0.05, FWE corrected). Compared to the NCs, significantly increased FCs in MDD patients were found between (A) the posterior cingulate cortex/precuneus and the right paracentral gyrus; (B) the left inferior temporal gyrus and the right cuneus; (C) the right anterior prefrontal cortex and the left cerebellum_4_5 (part extend to right cerebellum_4_5); (D) the right anterior PFC and the right middle frontal gyrus; (E) the right amygdala and the left inferior frontal gyrus (triangular part); (F) the right amygdala and the left rolandic operculum; (G) the left ventral hippocampus and the right inferior frontal gyrus (opercular part); (H) the left ventral hippocampus and the left inferior frontal gyrus (opercular part); (I) the left ventral hippocampus and the left inferior frontal gyrus (orbital part); (J) the right ventral hippocampus and the right inferior frontal gyrus (opercular part); and (K) the right ventral hippocampus and the left inferior frontal gyrus (opercular part). Decreased FC in MDD patients was found between the left posterior cerebellum and the left postcentral gyrus (L). Color scale denotes the t values; x, y, z, Montreal Neurological Institutes coordinates; L, left; R, right. The bar graph shows the z value of the above FCs (means and SD; * indicates P < 0.05, FWE corrected).

