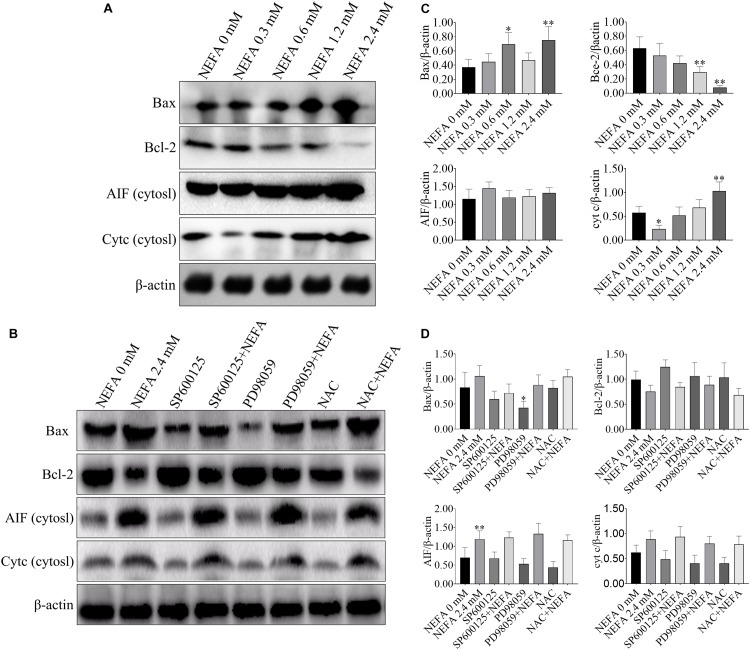
FIGURE 4.
Effect of NEFA on the expression levels of Bax, Bcl-2, cyt c, and AIF in hepatocytes. (A) The protein expression of Bax, Bcl-2, cyt c, and AIF in cytosol in dairy cows hepatocytes treated with various concentrations of NEFA (0, 0.3, 0.6, 1.2, or 2.4 mM). (B) The protein expression of Bax, Bcl-2, cyt c, and AIF in cytosol in dairy cows hepatocytes incubated without or with NEFA (2.4 mM) in the absence or presence of SP600125 (10 μM), PD98059 (10 μM), and NAC (10 mM). Quantification of (C) Bax, Bcl-2, AIF, and cyt c in the absence of SP600125 (10 μM), PD98059 (10 μM), and NAC (10 mM). Quantification of (D) Bax, Bcl-2, AIF, and cyt c in the presence of SP600125 (10 μM), PD98059 (10 μM), and NAC (10 mM). All results were obtained from three independent experiments and are expressed as the mean ± SD. *p < 0.05 and **p < 0.01 vs. the control group. #p < 0.05 and ##p < 0.01 vs. 2.4 mM NEFA-treated group.

