
Figure 4. Priming of Adaptive Responses is Restricted to the Local Vaccine-Draining LNs.
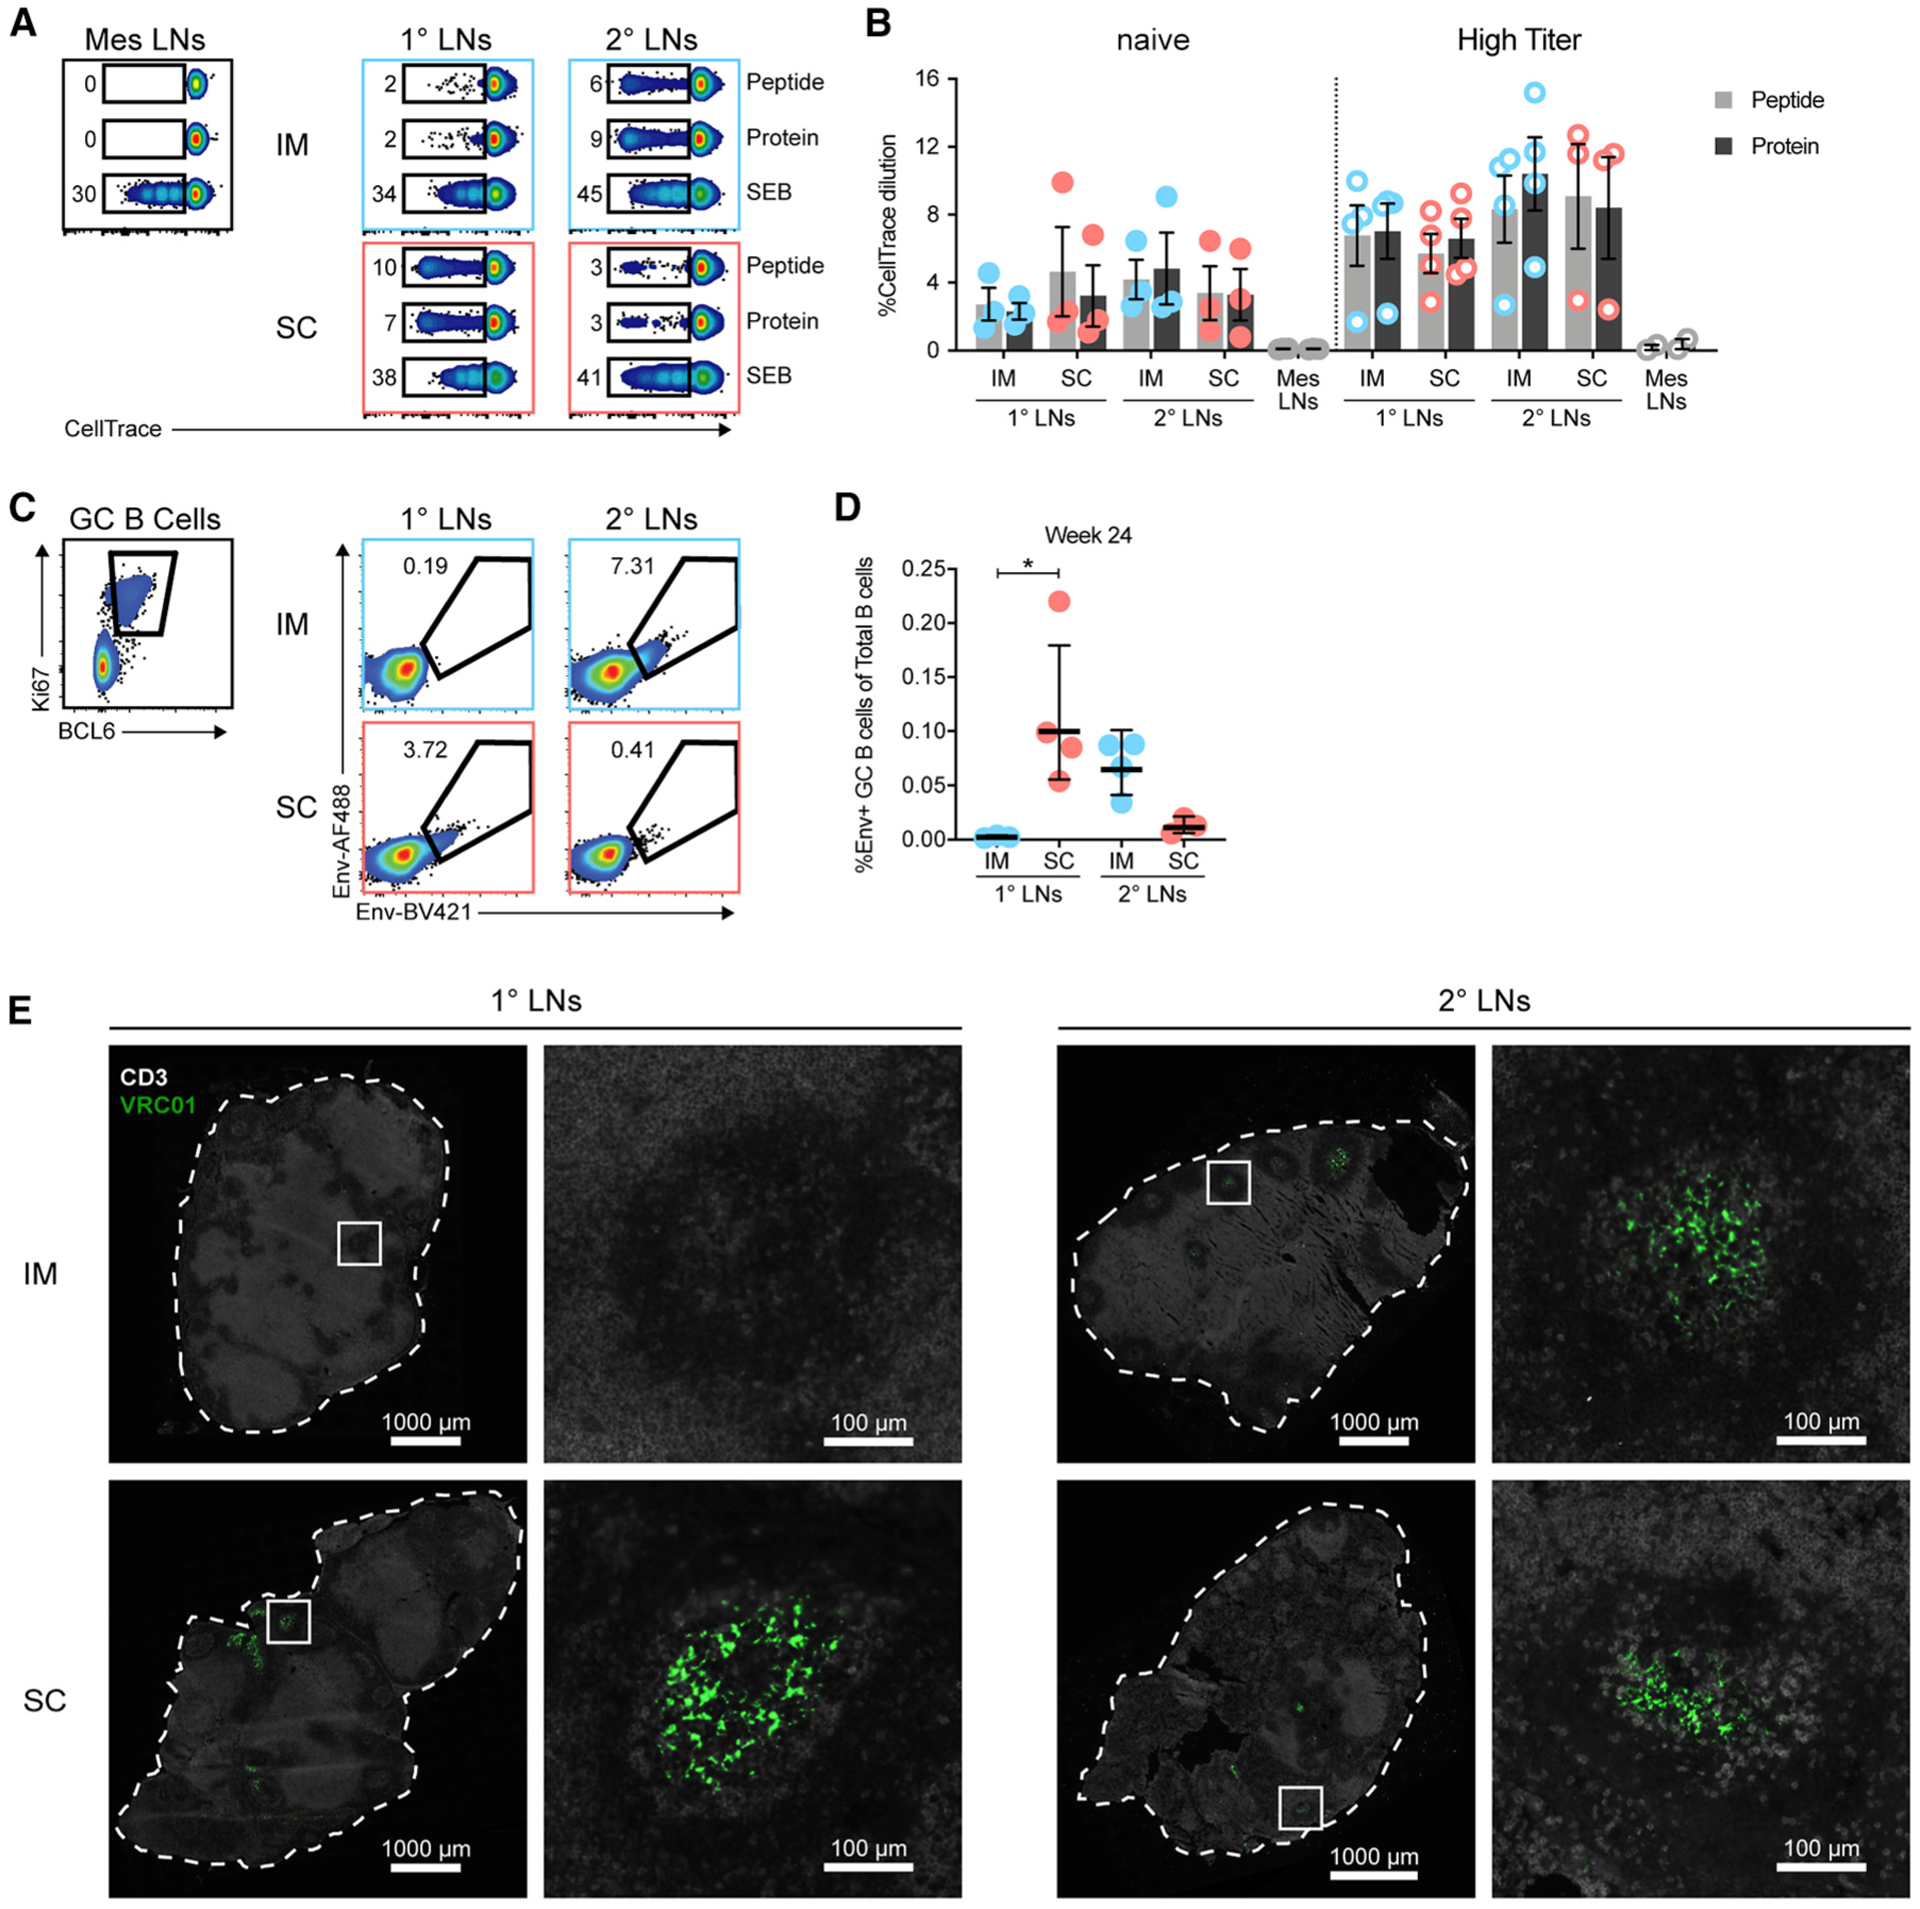
(A and B) T cell proliferation of LN cell suspensions from 24 h after immunization as measured using CellTrace dilution on day 5. (A) Representative flow cytometry plots of proliferating T cells in LNs of naive animals. LN samples are concatenated by condition. (B) Plotted is the percentage of CellTrace dilution in live CD3+ T cells. (C–E) LNs obtained from 30 days post-immunization four (week 24) of RMs from Figure 2. (C) GC B cells identified by expression of Ki67 and BCL6 from CD20+ CD3− cells. Env specificity was interrogated with dual-labeled probes. (D) Plotted is the percentage of Env-specific GC B cells of total CD20+ B cells. (E) Representative images of unlabeled Env localization in LNs stained for CD3 (white) and VRC01 (green). n = 4 LNs per group. Image brightness was increased to allow visualization.
In (B) and (D), mean and SEM are displayed. Data points represent individual LN clusters. n = 3 or 4 LNs per group. *p < 0.05. See also Figure S4.