Figure 3.
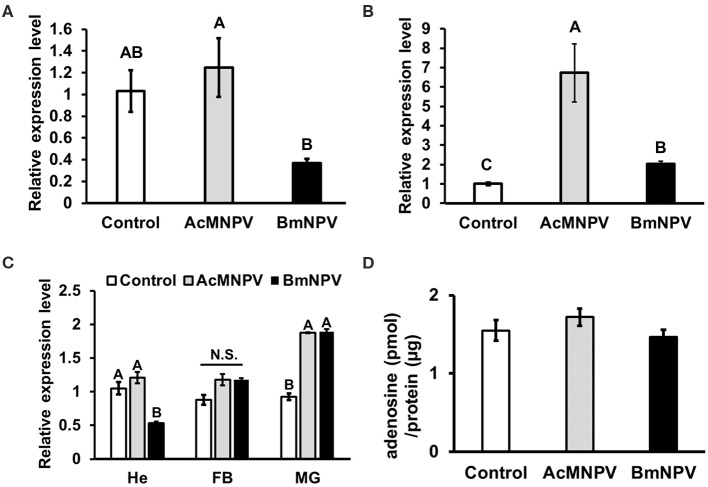
Regulation of adenosine signaling upon AcMNPV and BmNPV infection. RT-qPCR analyses of AdoR expression in B. mori larvae (A) BmN cells (B) as well as in different immune organs (C) upon AcMNPV or BmNPV infection at 48 h postinfection (hpi). (D) Measurement of hemolymph adenosine levels of larvae injected with PBS (control), AcMNPV or BmNPV at 48 hpi. All values are shown as the mean ± SEM of three replicates for qPCR and four replicates for adenosine measurement. Significance was determined by one-way ANOVA with Tukey's HSD post-hoc analysis; different letters for the treatment group indicate significant differences at P < 0.05. MG, midgut; HE, hemocyte; FB, fat body.

