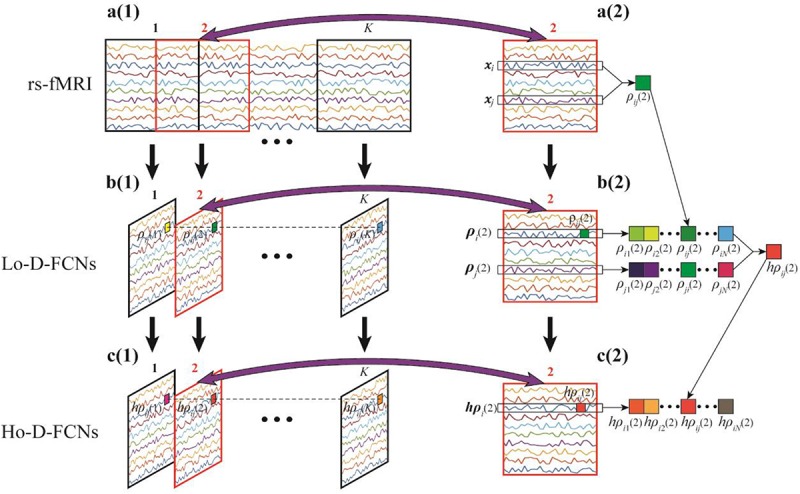
FIGURE 1.

Flow chart of constructing low- (Lo-D-FCNs) and high-order dynamic functional connectivity networks (Ho-D-FCNs), where (A1) denotes the resting-state functional MRI (rs-fMRI) time series associated with each region of interest (ROI), (A2) denotes the second rs-fMRI subseries based on a sliding window, (B1) is the Lo-D-FCNs, (B2) is the second subnetwork of Lo-D-FCNs, (C1) is the Ho-D-FCNs, and (C2) denotes the second subnetwork from Ho-D-FCNs.
