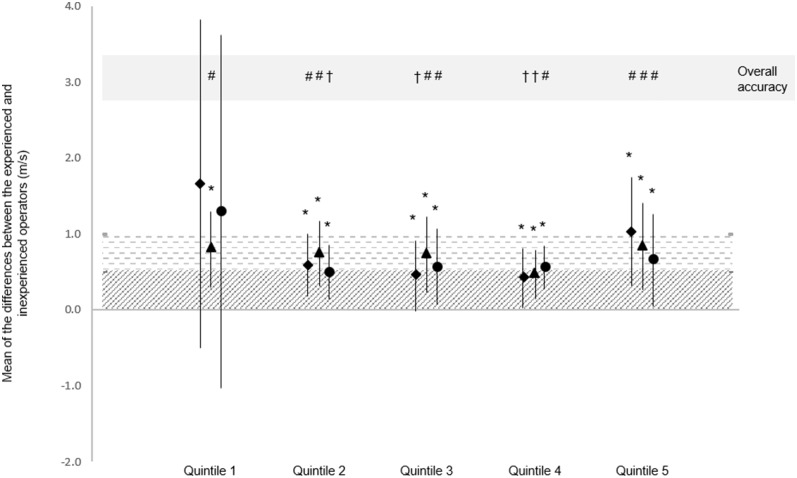
Figure 2.
Mean difference and SD of the mean differences between experienced and novice operator, and the qualitative outcome. Data represent the mean of the differences in PWV measured by experienced and novice operators, and the SD of the mean differences. Accuracy of the mean differences is represented using diagonal stripes (excellent accuracy) and horizontal stripes (acceptable accuracy). *Excellent SD accuracy. Overall accuracy is the worse of either the mean difference or SD qualitative interpretation: †Excellent overall accuracy; #Acceptable overall accuracy. ##PWV from 5 s recording; ††PWV from 10 s recording; ###PWV from 20 s recording. Quintiles were ordered chronologically according to test date and time (Quintile 1 contains first participants tested).

