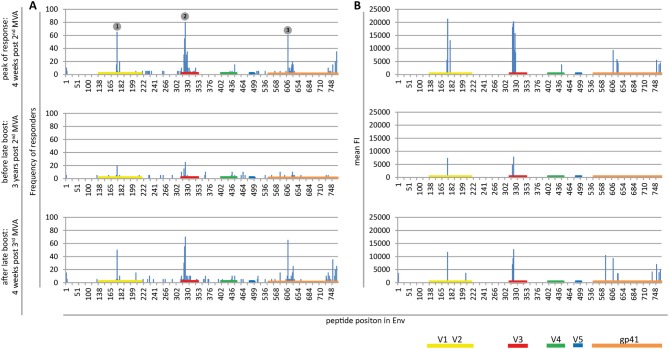
Figure 2.
Maps of linear IgG epitopes along the HIV-1 Env targeted by HIVIS03/06 vaccinees with frequency of responders (A) and mean FI (B) given for each time point tested. FI values of each peptide were mapped to the 10 full-length Env sequences included in the array. The maximum FI at each peptide position is then used as a basis for the calculation of the frequency of responders. IgG responses against individual antigenic regions were considered positive if the corresponding maximum FI was above 2,500 after subtraction of the pre-vaccination value. The mean FI was calculated from all vaccinees for peptide position-specific IgG responses occurring in at least 10% of vaccinees. Numbered dots mark immunodominant Env regions, summarized in Table 1. FOR and mean FI at 4 weeks post 2nd MVA separated by subtype are depicted in Supplementary Figure 2.

