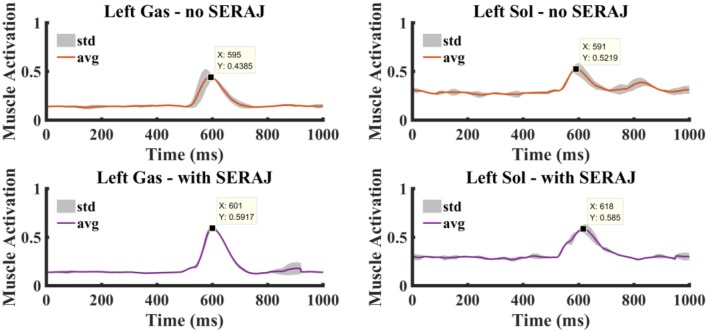
Figure 10.
The muscle activation curves at the left ankle joint. Right column shows the gastrocnemius muscle activation without and with the series elastic robot ankle joint (SERAJ) kneed on the subject's right ankle. Left column shows the soleus muscle activation without and with the SERAJ kneed on the subject's right ankle. Solid lines represent average values, and gray-shaded areas show standard deviation.

