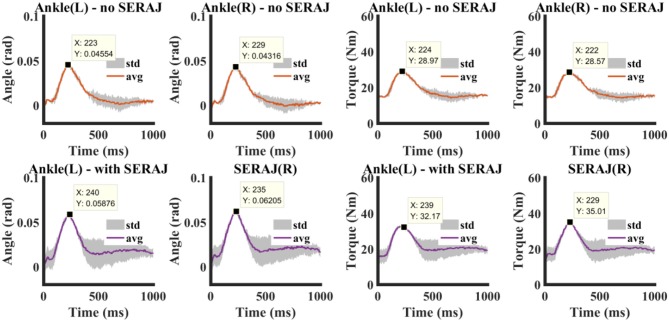
Figure 9.
Experimental data of a representative subject in “Ball-disturbance” trials. Upper and lower panels show experimental results without and with SERAJ, respectively (where the red/purple lines and the gray-shaded areas represent the average and standard deviation of measurement results of experiments, respectively). Maximum values of each curve are attached in the panel.

