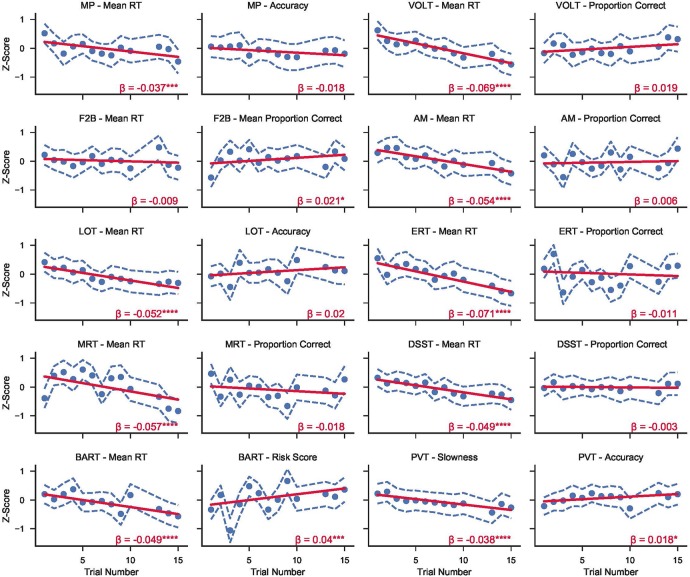
FIGURE 2.
Z-transformed standard speed and accuracy metrics from the 10 tests in the Cognition battery over time in mission across both campaigns at HERA. Circles refer to the mean score across subjects from both campaigns for each trial number. Dashed blue lines show the 95% CI range around each mean point. Solid red lines represent mixed effects linear models fit to the data for each variable. β refers to the linear slope of the regression model (i.e., change in z-score per trial). Asterisks refer to significance levels after adjusting for multiple testing with the false discovery rate method with p-values referring to H0: regression line slope = 0. (*p < 0.05; **p < 0.01; ***p < 0.001; ****p < 0.0001).

