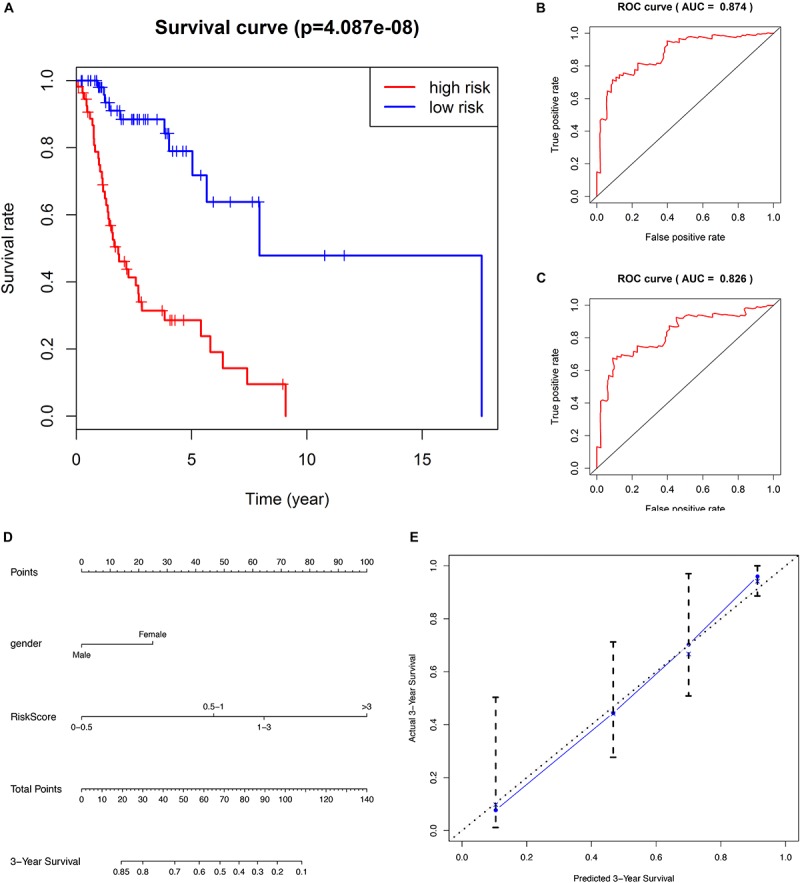
FIGURE 2.

(A) Kaplan–Meier survival analysis indicates that the survival rate of low-risk patients was significantly higher than high-risk patients. (B) ROC curve of predicting 3-year survival with the AUC of 0.874. (C) ROC curve of predicting 5-year survival with the AUC of 0.826. (D) The nomogram combines patient gender with RiskScore to predict 3-year OS in patients with LSCC. (E) The calibration curve is used to evaluate the accuracy of the nomogram and shows good consistency between predicted survival and actual survival.
