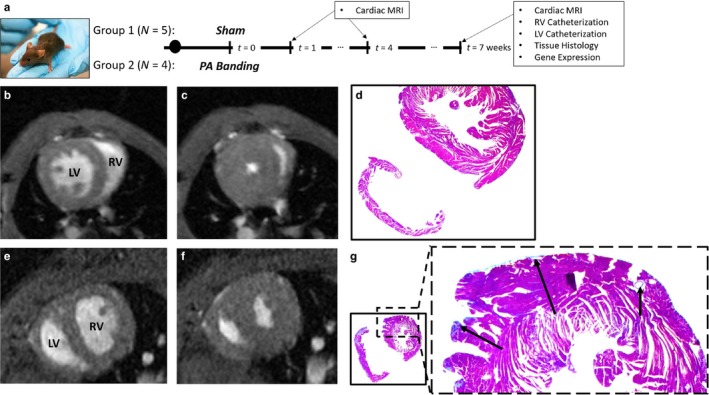
Figure 1.

(a) Overall study design, timeline, and analysis; (b and c) Short axis cardiac MRI of a Sham mouse at (b) end‐diastole and (c) end‐systole. (d) Histology with collagen staining shown in blue for a randomly selected Sham mouse. (e, f) Short axis cardiac MRI of a PAB mouse at (e) end‐diastole and (f) end‐systole, respectively. (g) Histology with collagen staining in the LV of a randomly selected PAB mouse. Arrows show visible regions of fibrosis
