
Figure 3.
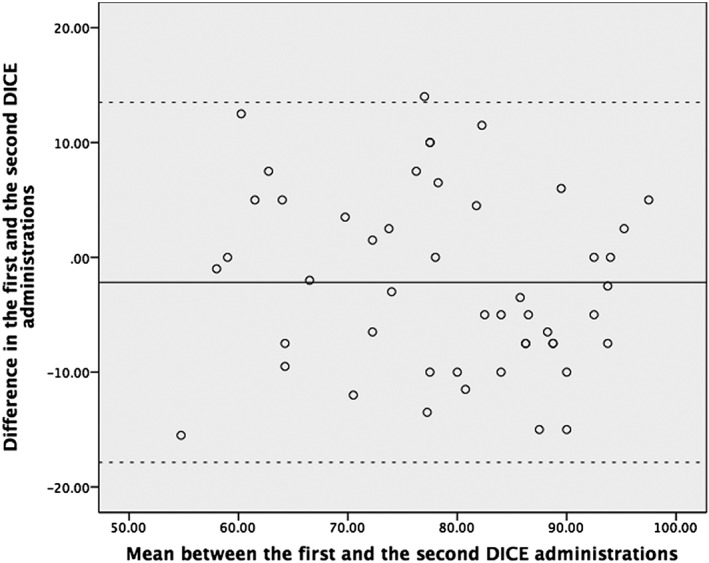
Bland–Altman plot for reliability: Agreement between the first and the second Dietary Index for a Child's Eating (DICE) administration. A solid line represents the mean difference between two DICE total scores and dashed lines representing the limits of agreement (mean difference ± 1.96 standard deviations)