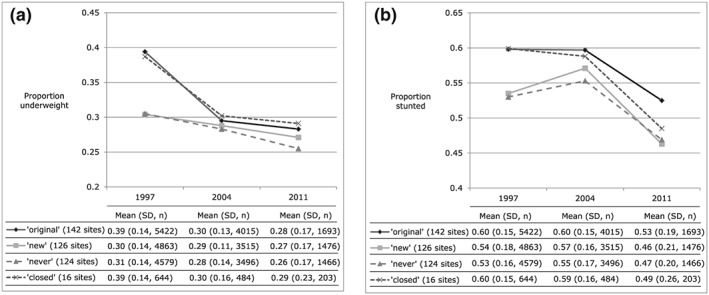
Figure 1.

Line graphs for the proportion of (a) underweight and (b) stunting among children under 5 years by survey year for each of the four site types (“original,” “new,” “never,” and “closed”). Included under each line graph is a table of the raw mean underweight or stunting proportion with standard deviation (SD), total number of children by site type (n), and number of sites by site type.
